Using historical LTVs to refine pLTV confidence
One of the challenges in analyzing data on user behavior is it isn’t always clear on what you should actually do with your gathered insights. This is often because a finding doesn’t always give you an indication of how much you can actually trust the outcome. When onboarding new customers, one of the most common questions we get is “how reliable are predicted LTVs?” This is probably the single biggest question that every single marketer faces: how confident should I be in the projected success of my campaigns?
Of course you’ll never have perfect projections and like most things, familiarity and expertise will provide you guidance. To share some of our learned expertise, we’ve outlined a simple shortcut for gaining confidence in your predicted LTVs by relying on historical predictions.
Outline historical cohorts
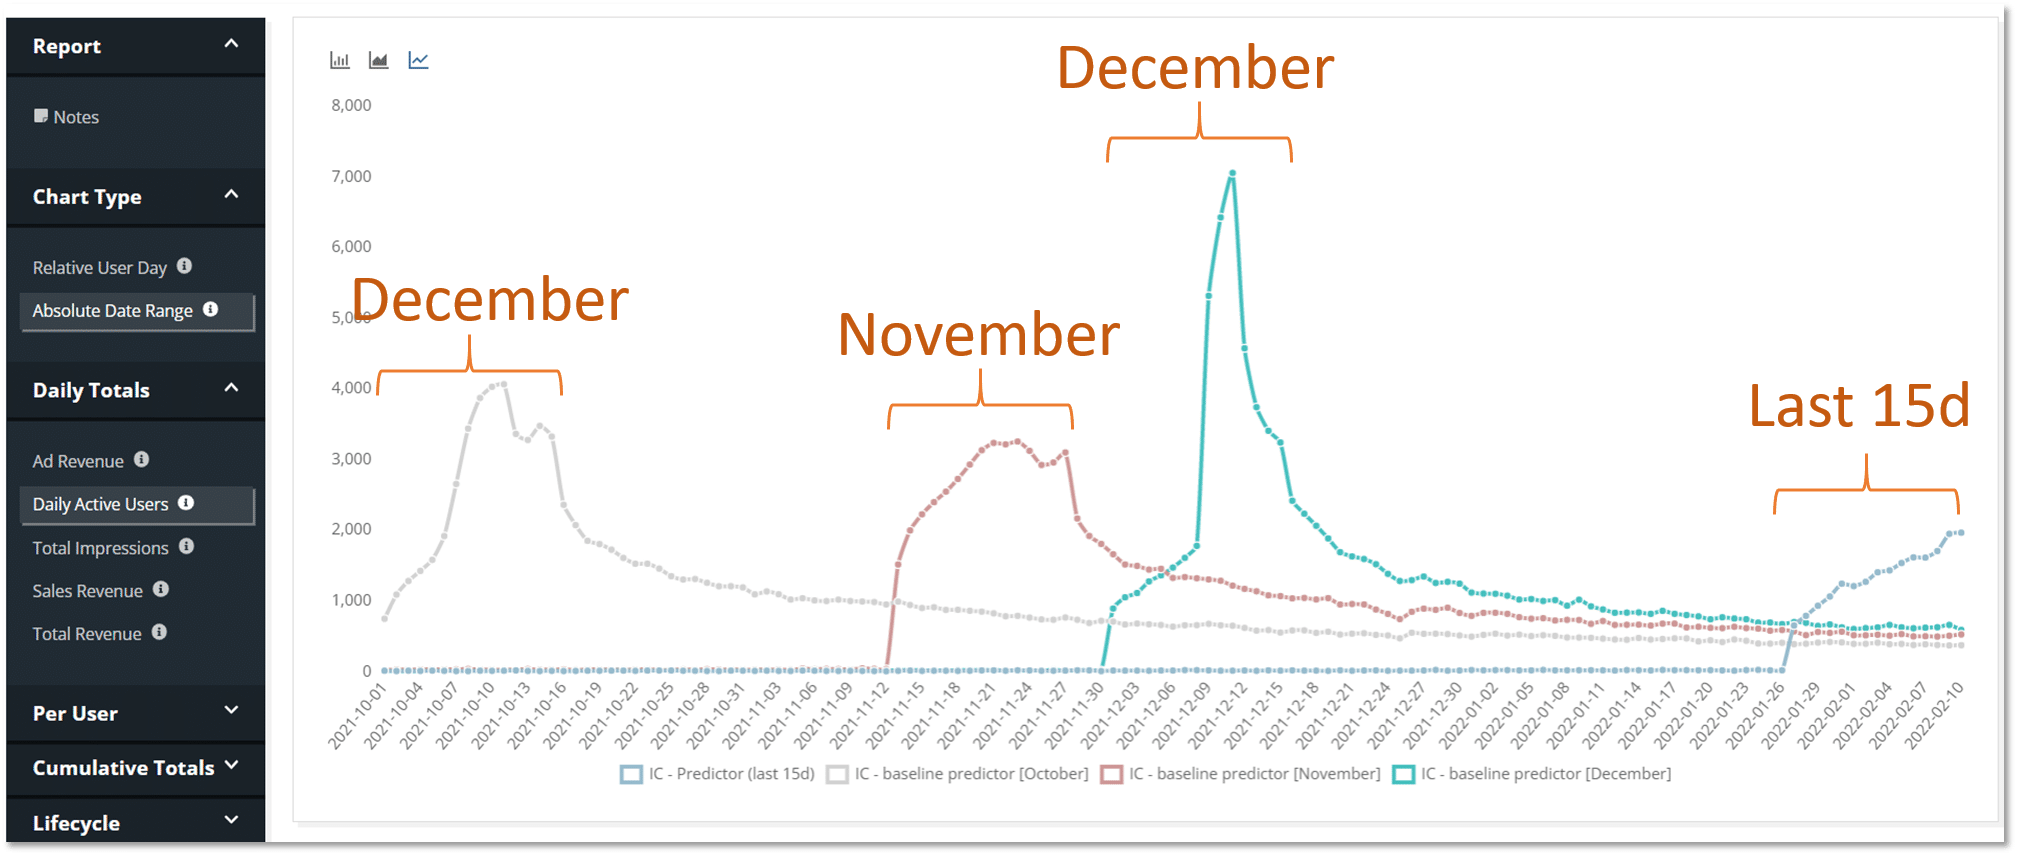
You’ll need some historical data to get started. In our example we have four cohorts of users who’ve installed during 2-week periods, going back 120 days. This gives us four roughly equal amounts of users to set baselines.

A report showing the daily active users of our cohorts.
Run projections and check your accuracy
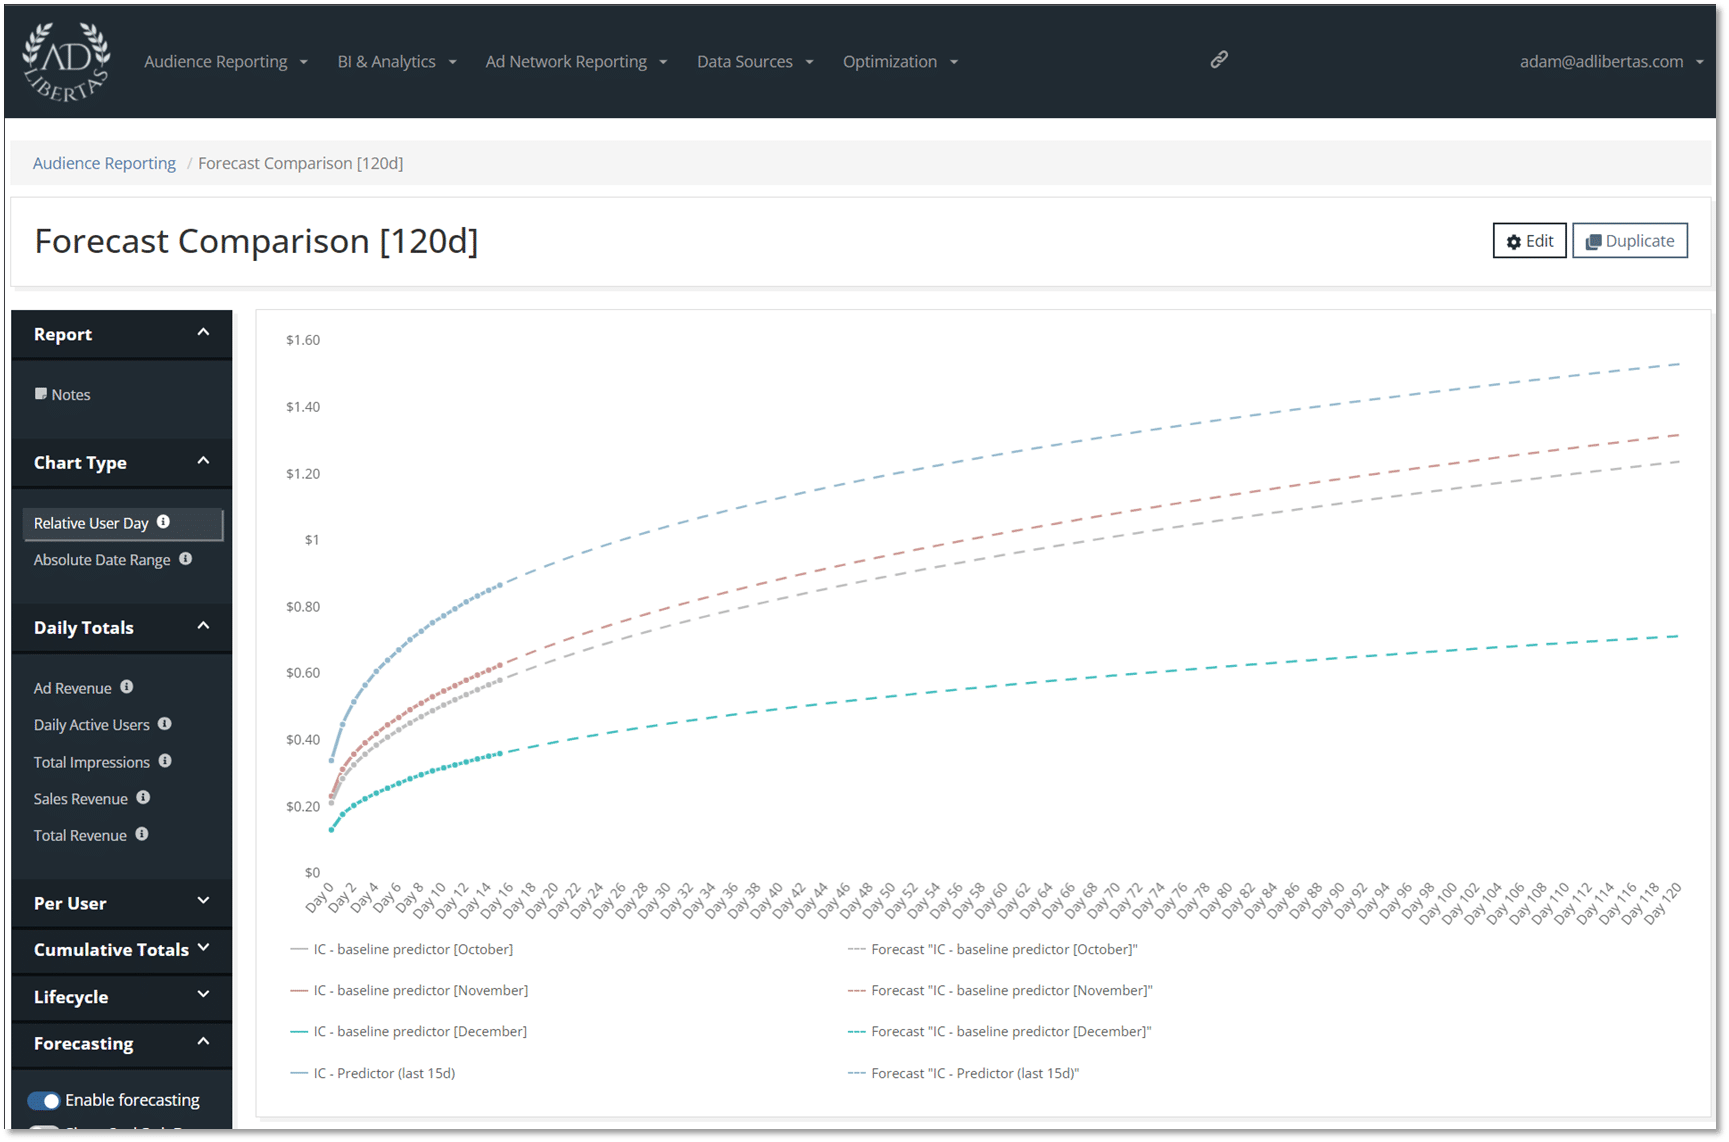
Next, you’ll want to project LTVs over the lifetime of the users, choosing the mathematical regression model that closest fits the actuals. Record the predictions from this model on the historical cohorts vs their actual earnings.
Click on the image to expand
In the example above, we’re using a power regression calculation that ignores the first 14d of data. The best-fitting model for you will vary depending on your app and users.
Click on the image to expand
This example represents a very interesting change in LTVs over time, and while the CPMs and/or buying changes aren’t included in the scope of this article, it’s fair to say a change in buying behavior has/will happen on this app.
Outline your comparisons to glean confidence
Once you have comparisons, this should give you a good indication of how reliable your predictions have been. You’ll want to look at averages and the deviation of the predictions. Your comfort level and risk tolerance – and by extension buying volume – will dictate what you feel comfortable with.
Historical prediction accuracy

In this example historical predictions do a solid job when compared against actuals.
In this example we have a fairly strong signal that our predictions are solidly reliable when projected from 15d, and this means you can lean into your ROAS targets confident projected earnings are well within reason. When applied to your campaigns, this can provide an extremely valuable signal and confidence on your campaign management.
ROAS report with predictions & accuracy

A report of all campaigns can give you ROAS against targets (120d in this case) as well as the historical accuracy to help you make a decision on budget allocation.
Act on your findings
You likely have — or will need — campaign goals: year-1 ROAS, for example. You’ll need confidence in your projections as early as possible. By applying predictions, leaning on historical findings for confidence, triangulating day-1 events to predict user behavior you should have a good, early understanding of your likely outcomes. Our customers work with us to outline their strategy then have campaign outputs delivered to help them allocate budget and optimize campaigns.


