Q2: Ad Network Performance
Q2: Ad Network Performance
Foreward:
In today’s post we present a comprehensive look-back on top network performance over the tumultuous year thus far. Our goal is to help app developers make intelligent choices in choosing the right ad network partners.
Previous Reading:
– Want to know the CPM rates by ad unit? Check out our ad-unit break-down for 2020.
– Is the mobile ad market mimicking the stock market? Is the market in a V-shaped recovery?
Banner CPM Index (by week)
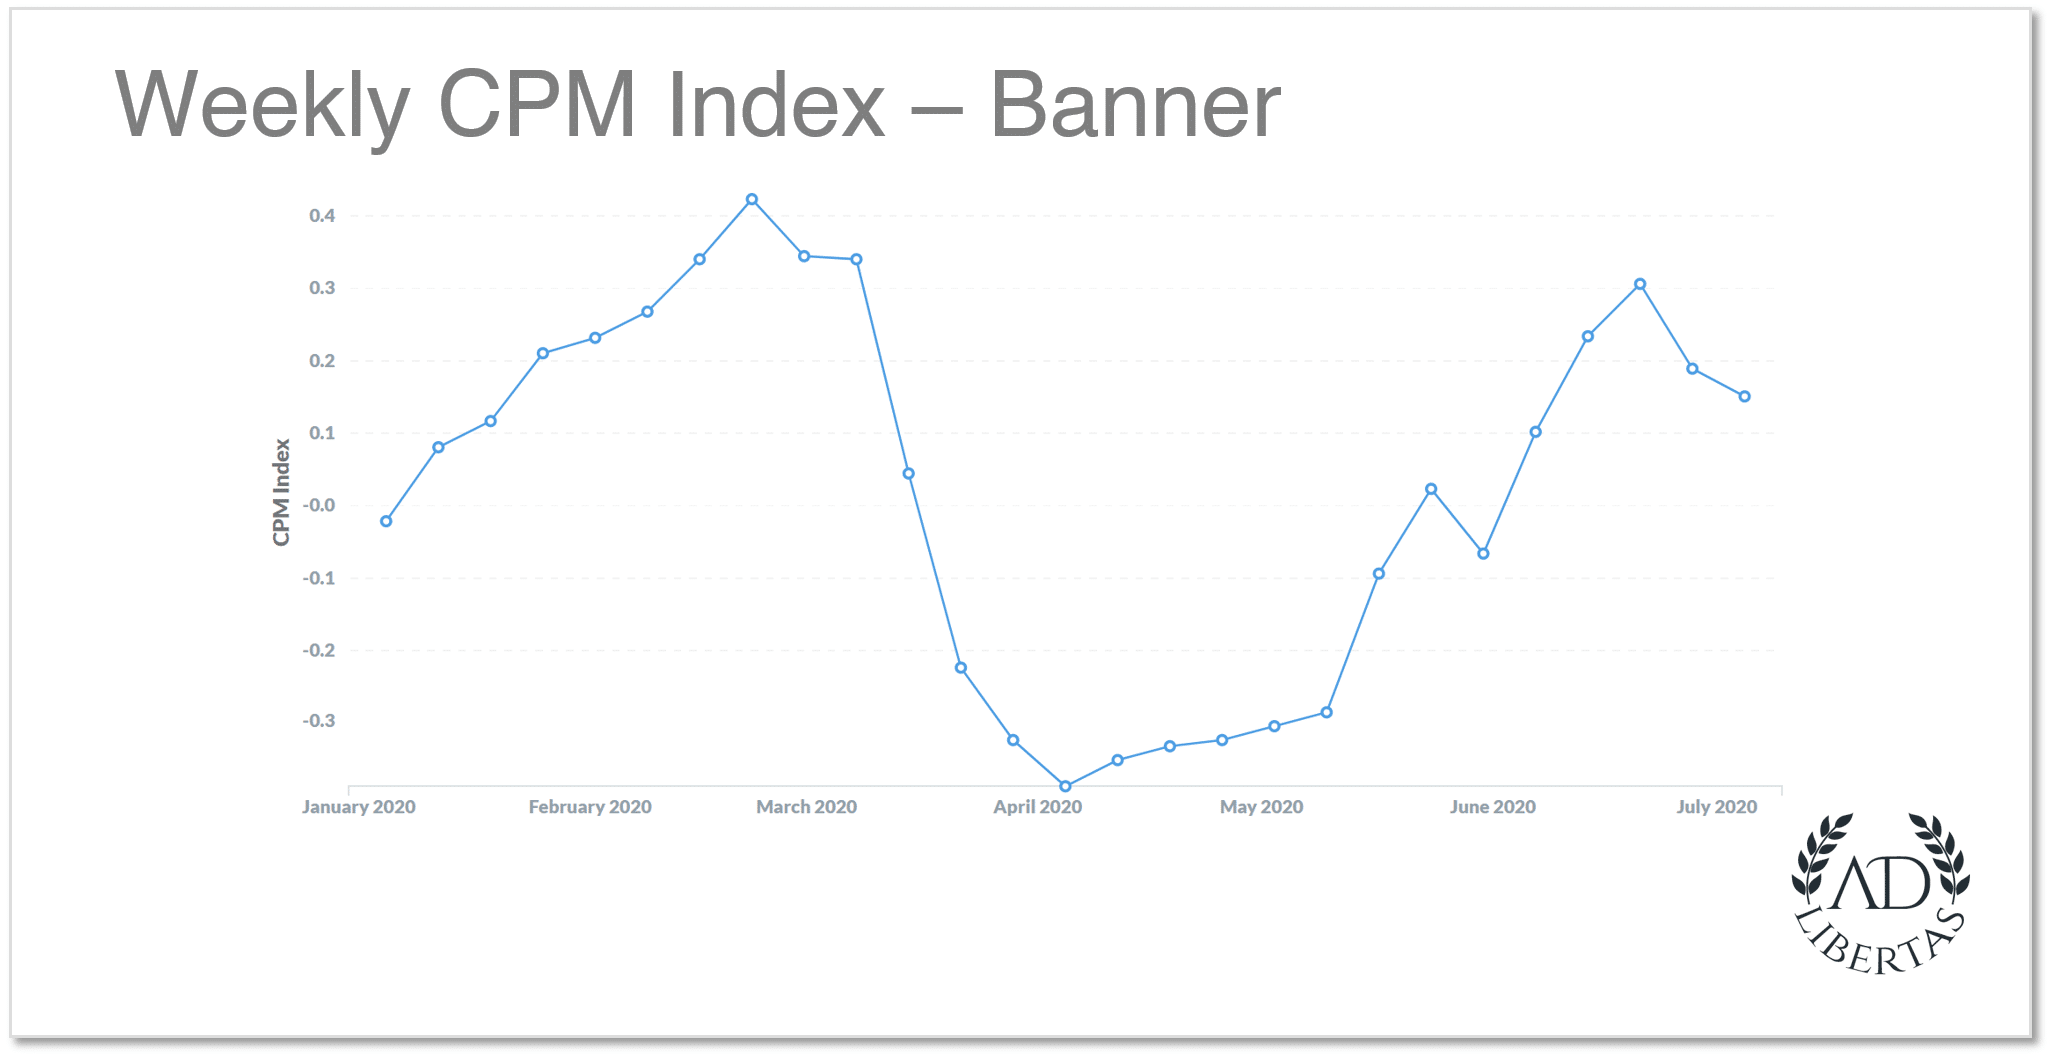
Summary: The swinging pendulum – Reaching a low of (40%) off-market average in early April, Q2 saw a +30% resurgence in banner performance, which is welcome news for many app developers.
– While rates have softened as we reached the end of the quarter in the last few days we’ve seen movement back towards the mid-June levels.
– Pre-COVID and Q1 CPMs discussed in our April 21st market update.
– Daily CPMs continue to come back, mirroring the stock market’s recovery.
Network Banner Performance Notes:
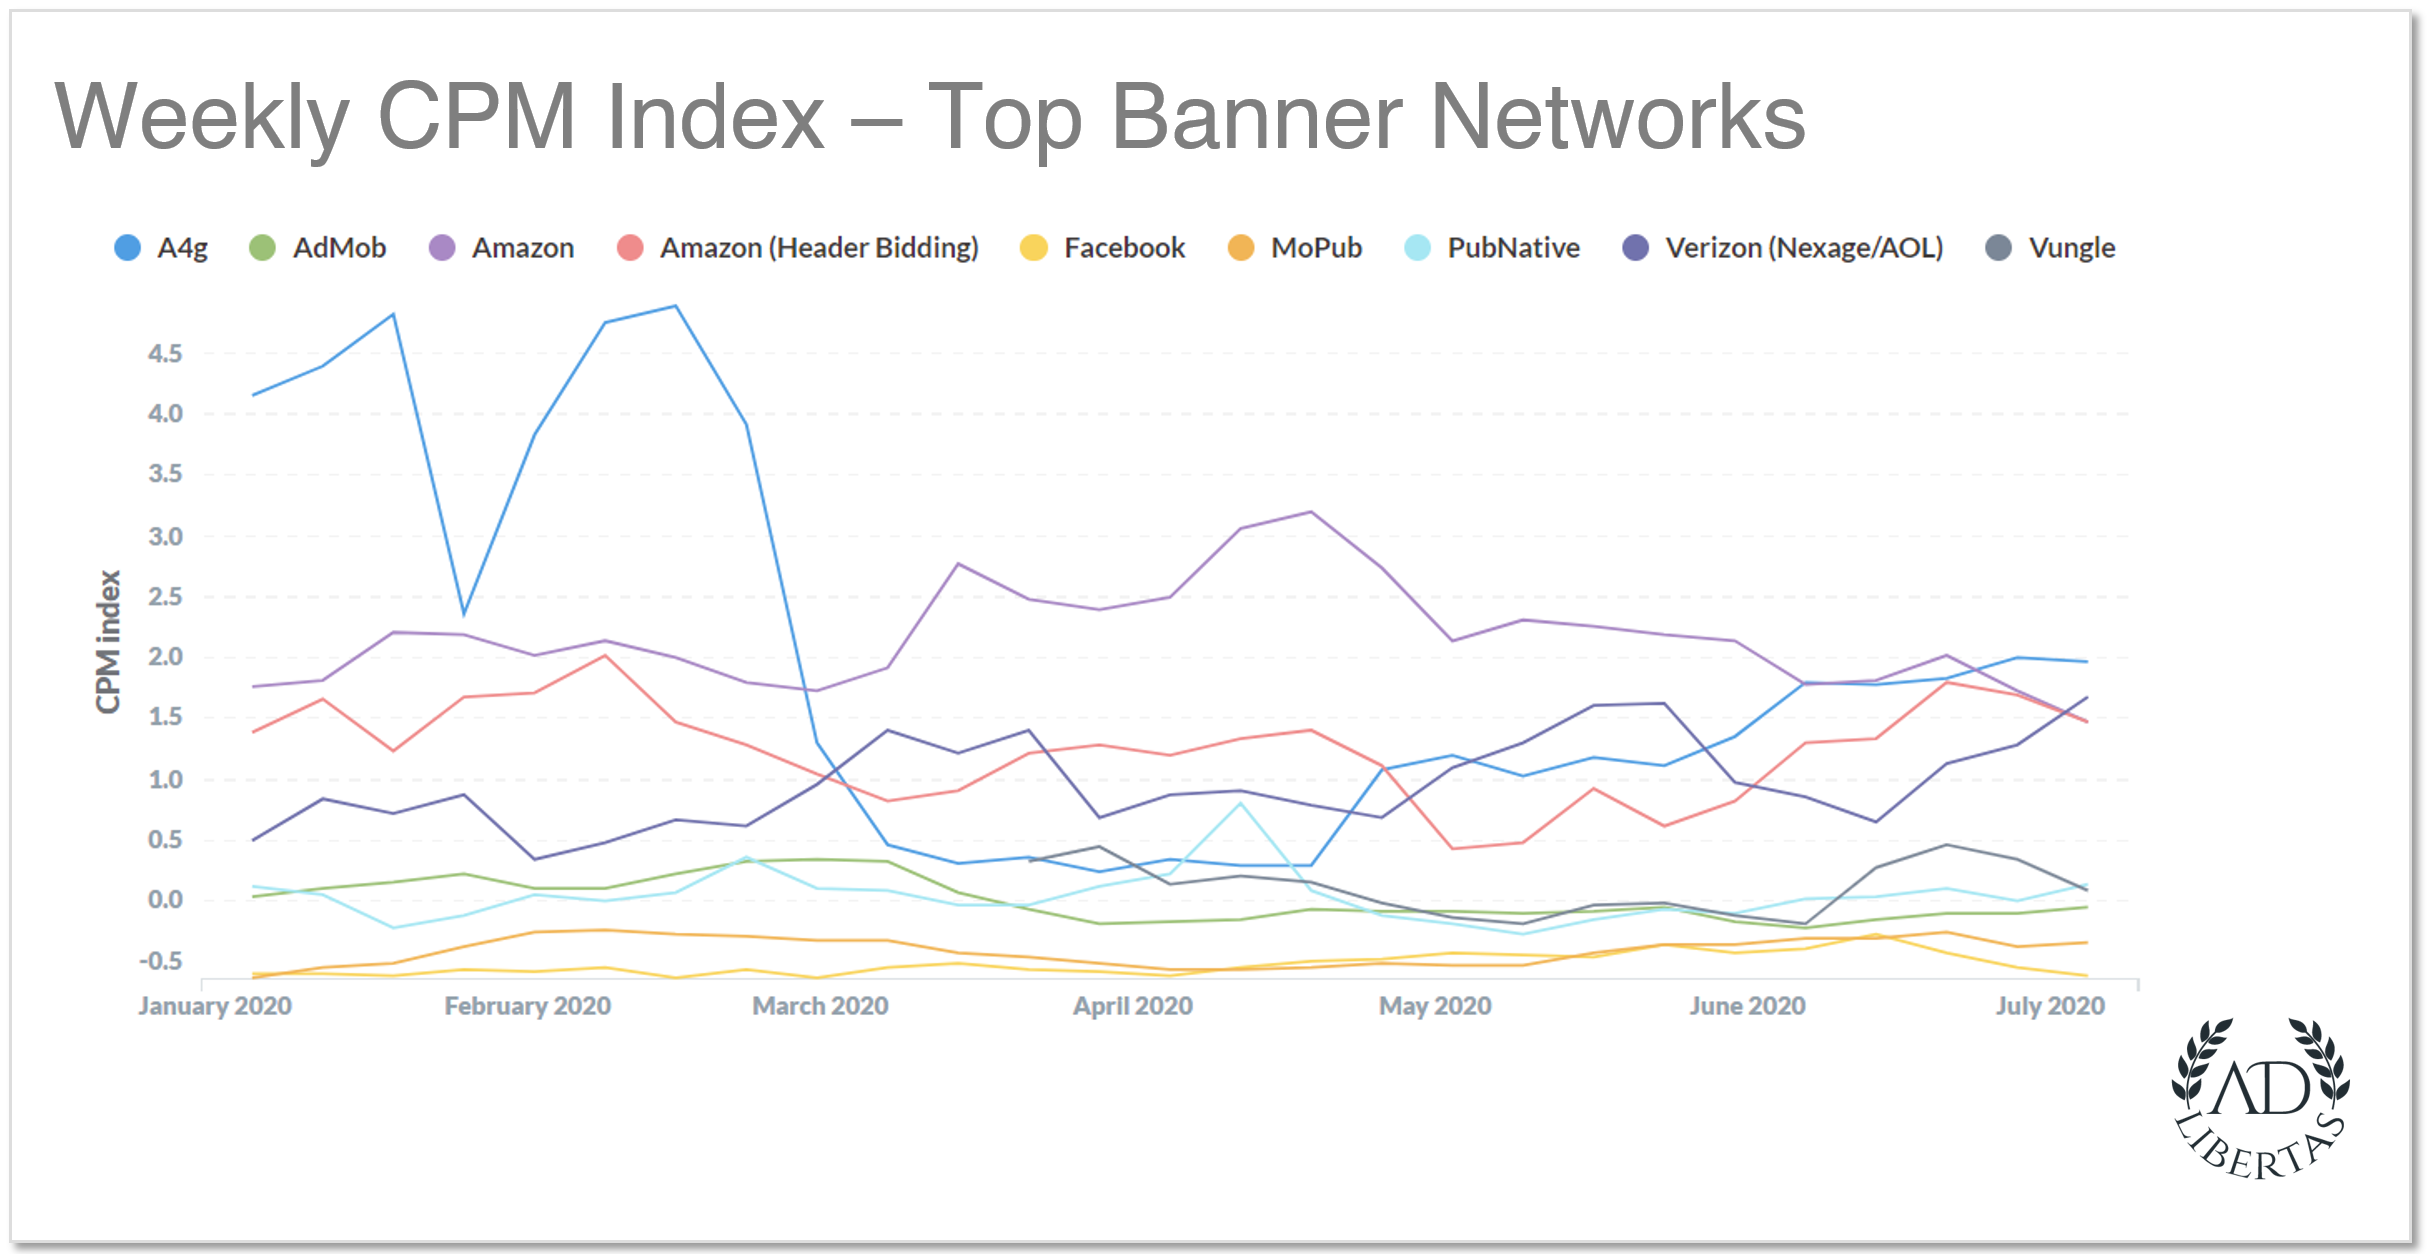
Amazon was the clear performance winner throughout the first-half of the year but the surge from COVID-times have softened, and — uncharacteristically for Amazon– they have lost the top spot for CPM performance.
A4G is a new addition to the top network list, having contributed massively-high averages in Q1 but — typical with smaller networks — was largely impacted by the COVID shuffle. However they remain a solid buyer coming back to claim top-spot for CPMs at Q2 quarter-end.
Vungle is a noteworthy addition in the banner section, we traditionally haven’t seen them play much in the banner space. Yet, in only a few months they’ve managed to capture a top-spot among banner networks.
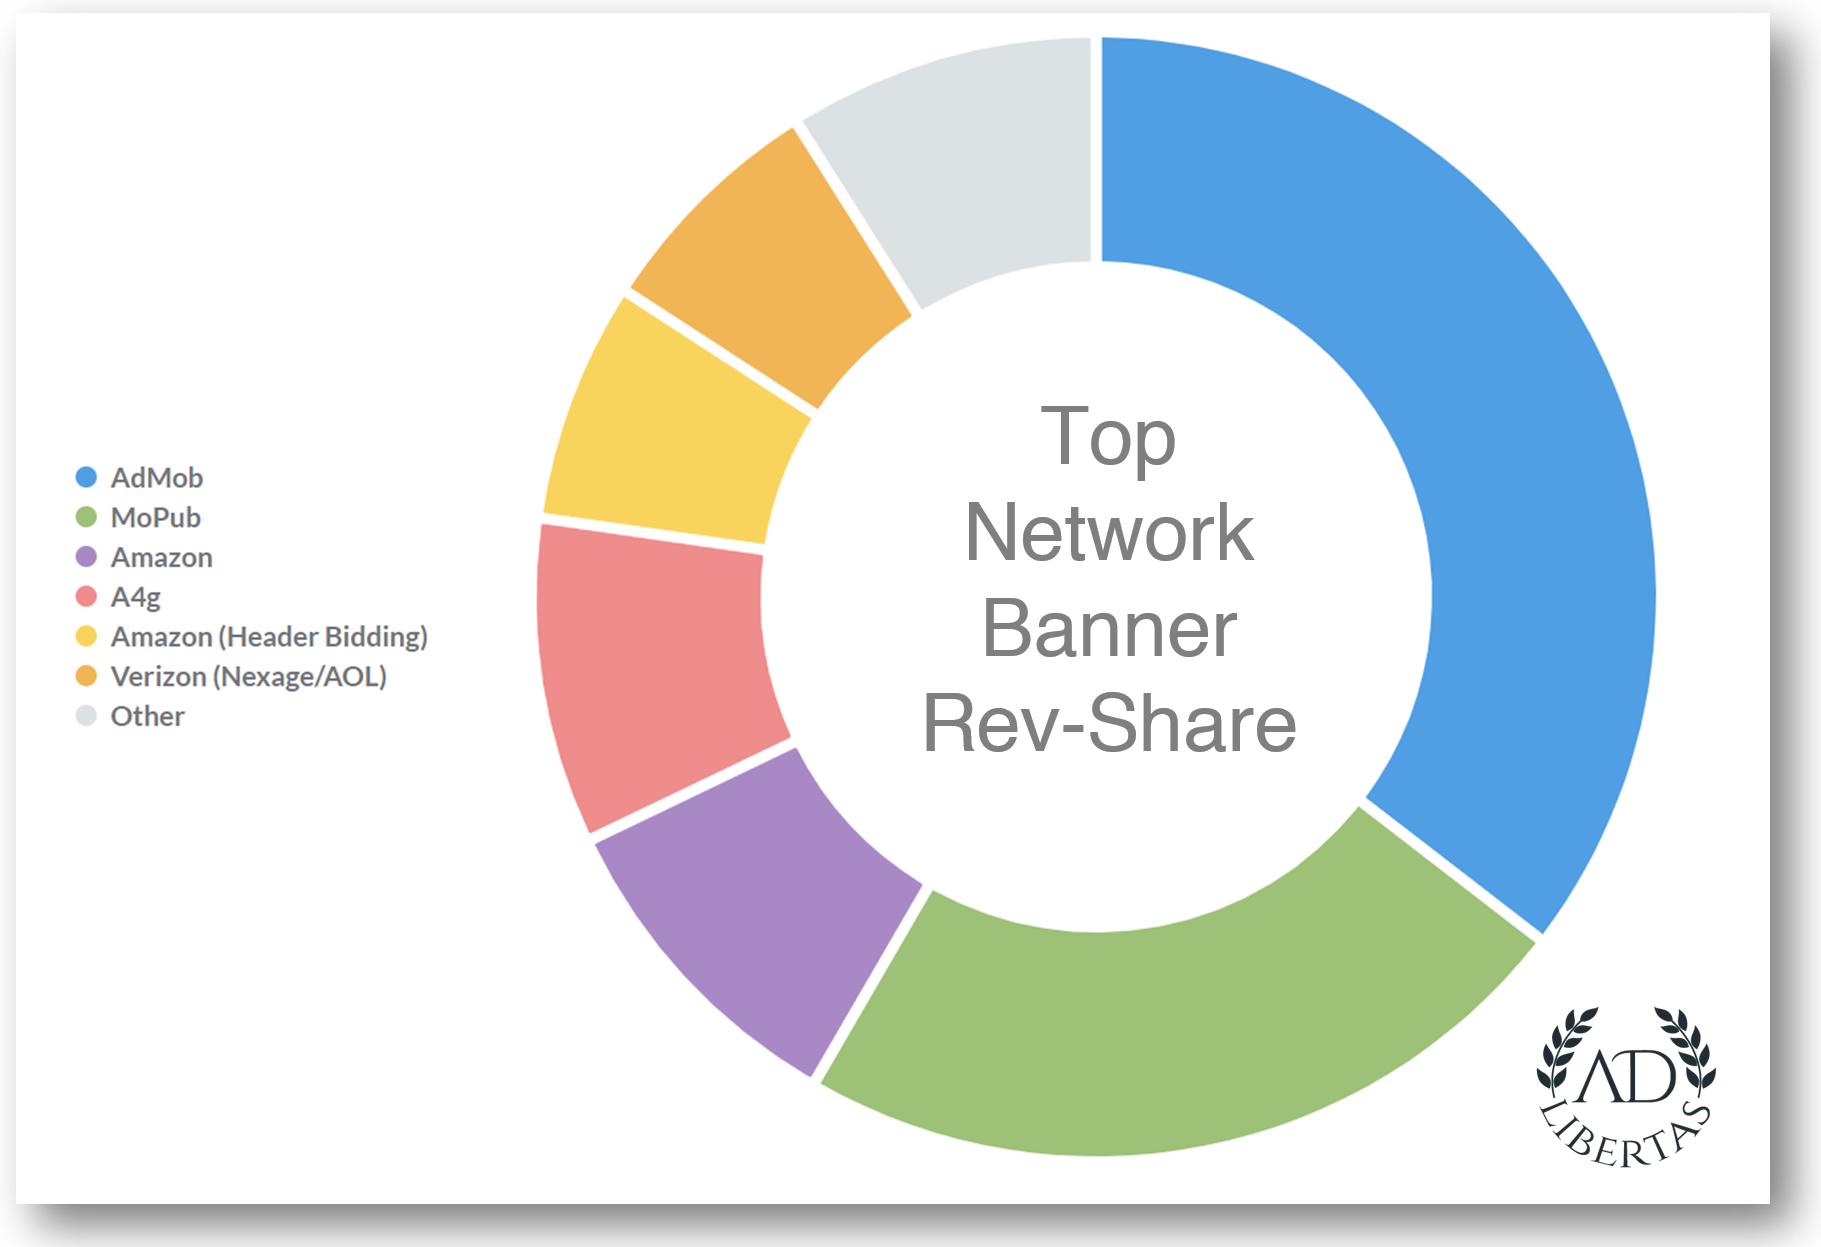
Admob & Mopub remain the giants in banner revenue and should not be ignored. Their revenue-contribution of both account for over half of all banner revenue.
Full Screen: 2020 YTD
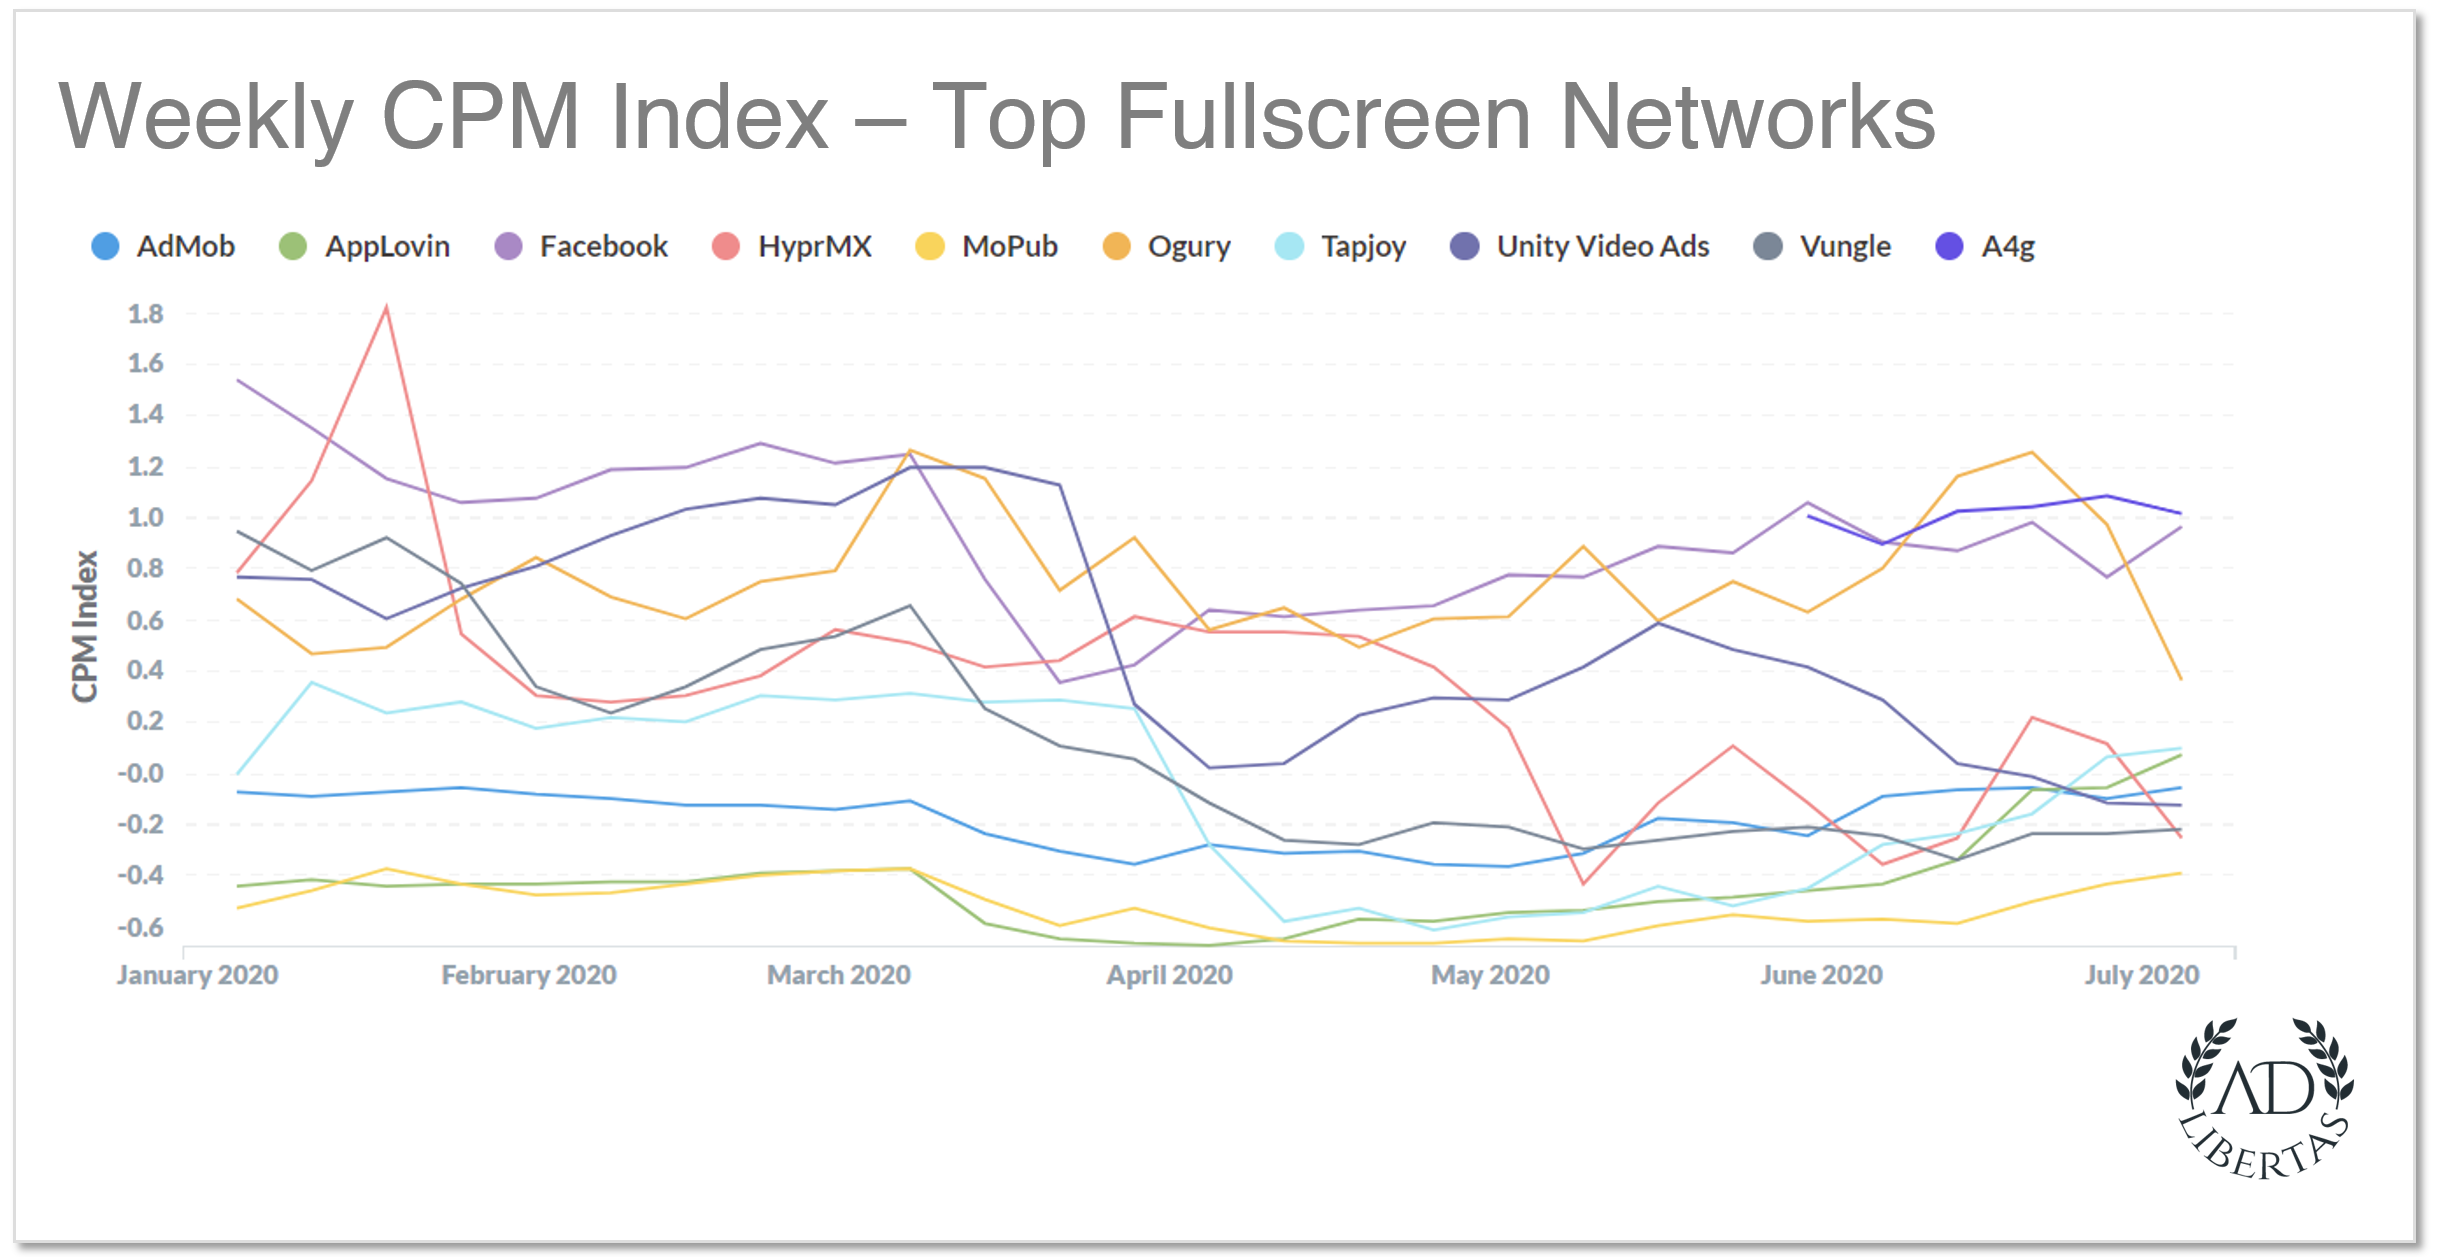
Fullscreen CPM Index (by week)
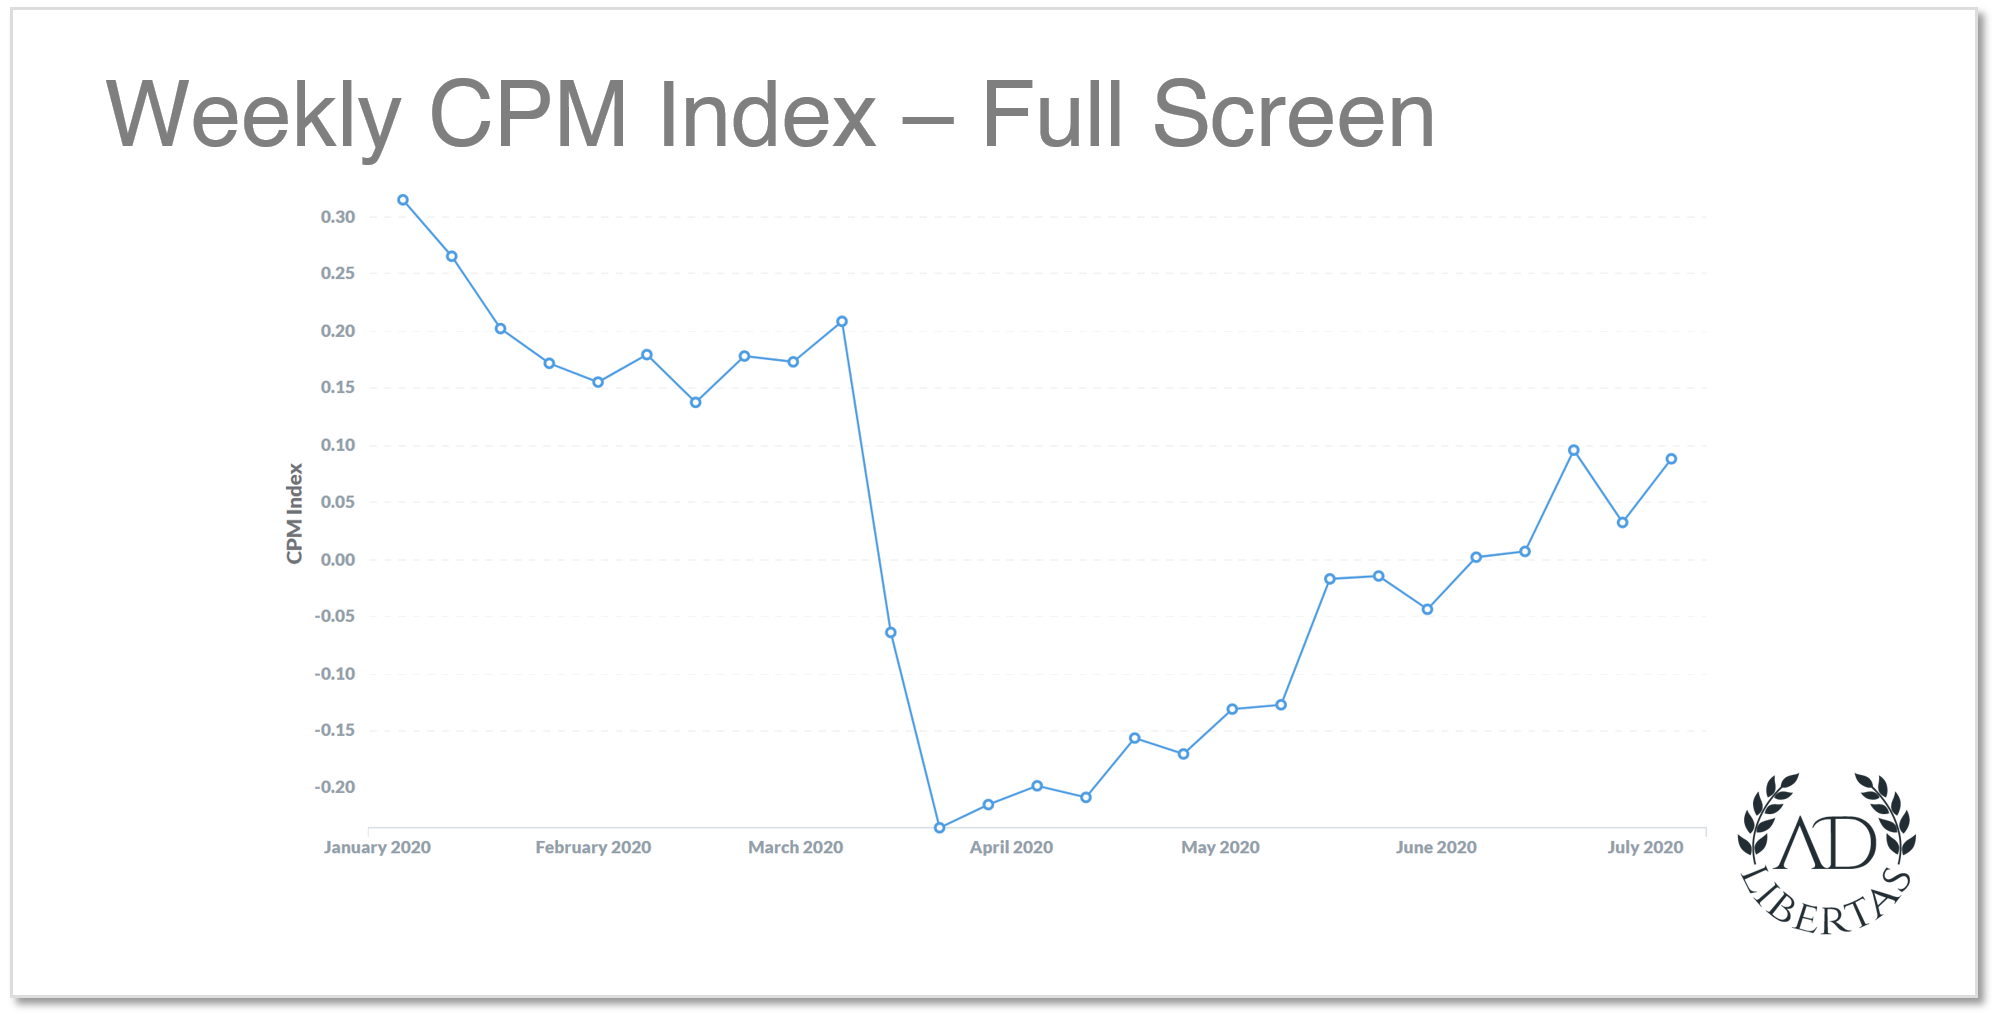
Summary: Coming back to average. Similar to the performance rebound of banners, fullscreen prices have continued their slow-measured recovery from their down-rates of (20%) through the end of Q2. But unlike banners — only saw a small dip in performance at the end of July and are actually up 10% against the yearly average.
– Pre-COVID and Q1 CPMs discussed in our April 21st market-update.
– Daily CPMs continue to come back, mirroring the stock market’s recovery.
Fullscreen Network Notes:
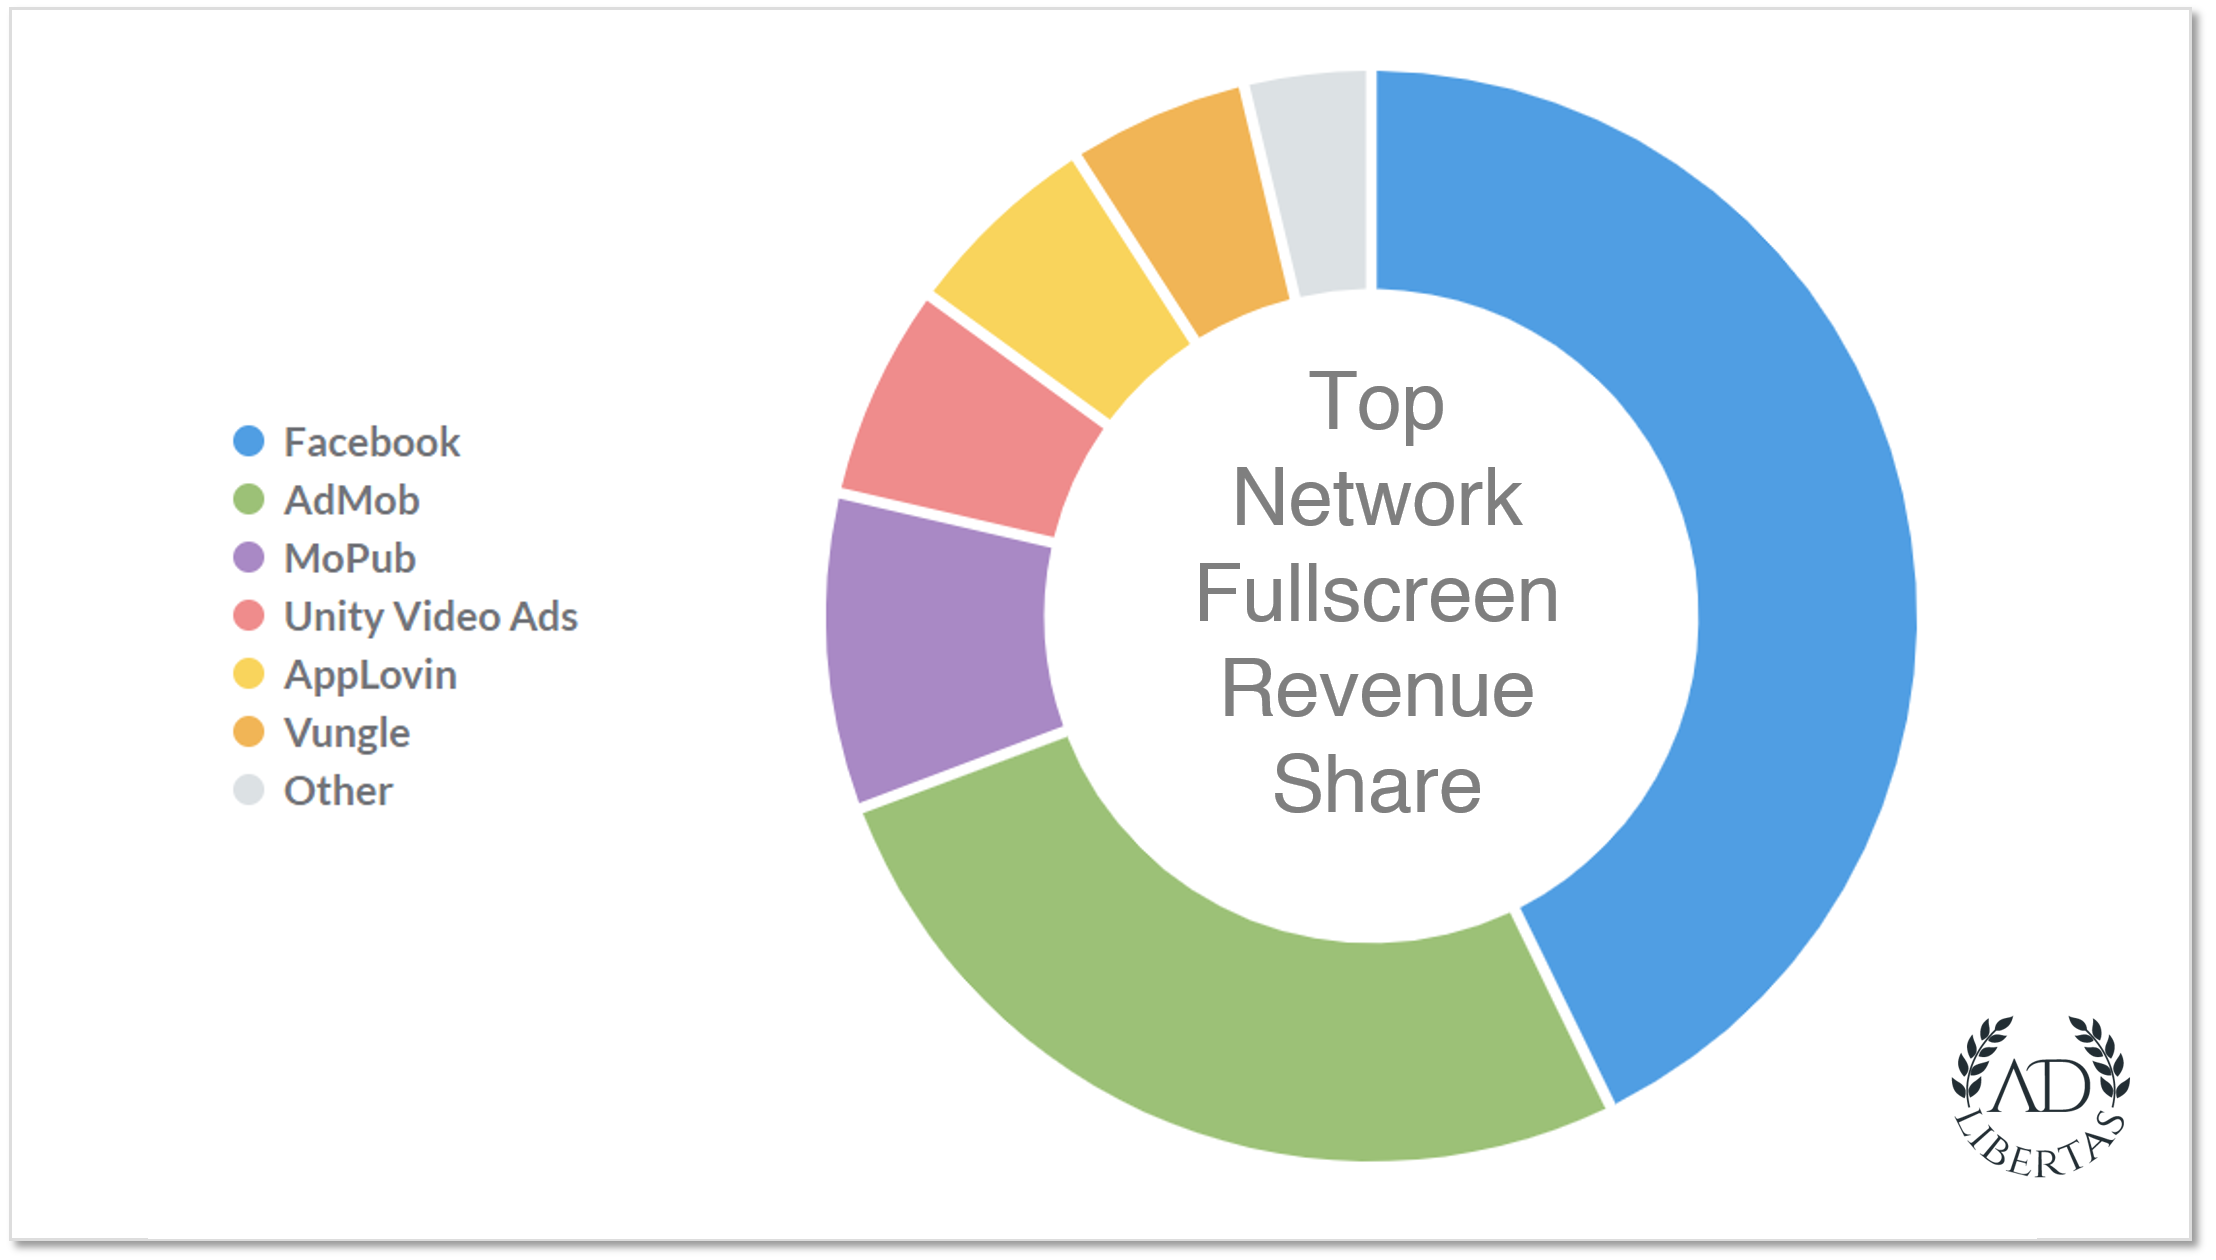
Facebook – Remains the main driver of fullscreen revenue, and– as you’d expect — they drive the market performance dips and recovery-curve for the rest of the market.
Admob and MoPub — the other top market drivers — delivered fairly consistent prices during the entire first half of the year.
A4G: Makes a splash in fullscreen inventory, only starting to buy in earnest at the end of Q2, but still manages a top spot.
Reward Video: 2020 YTD
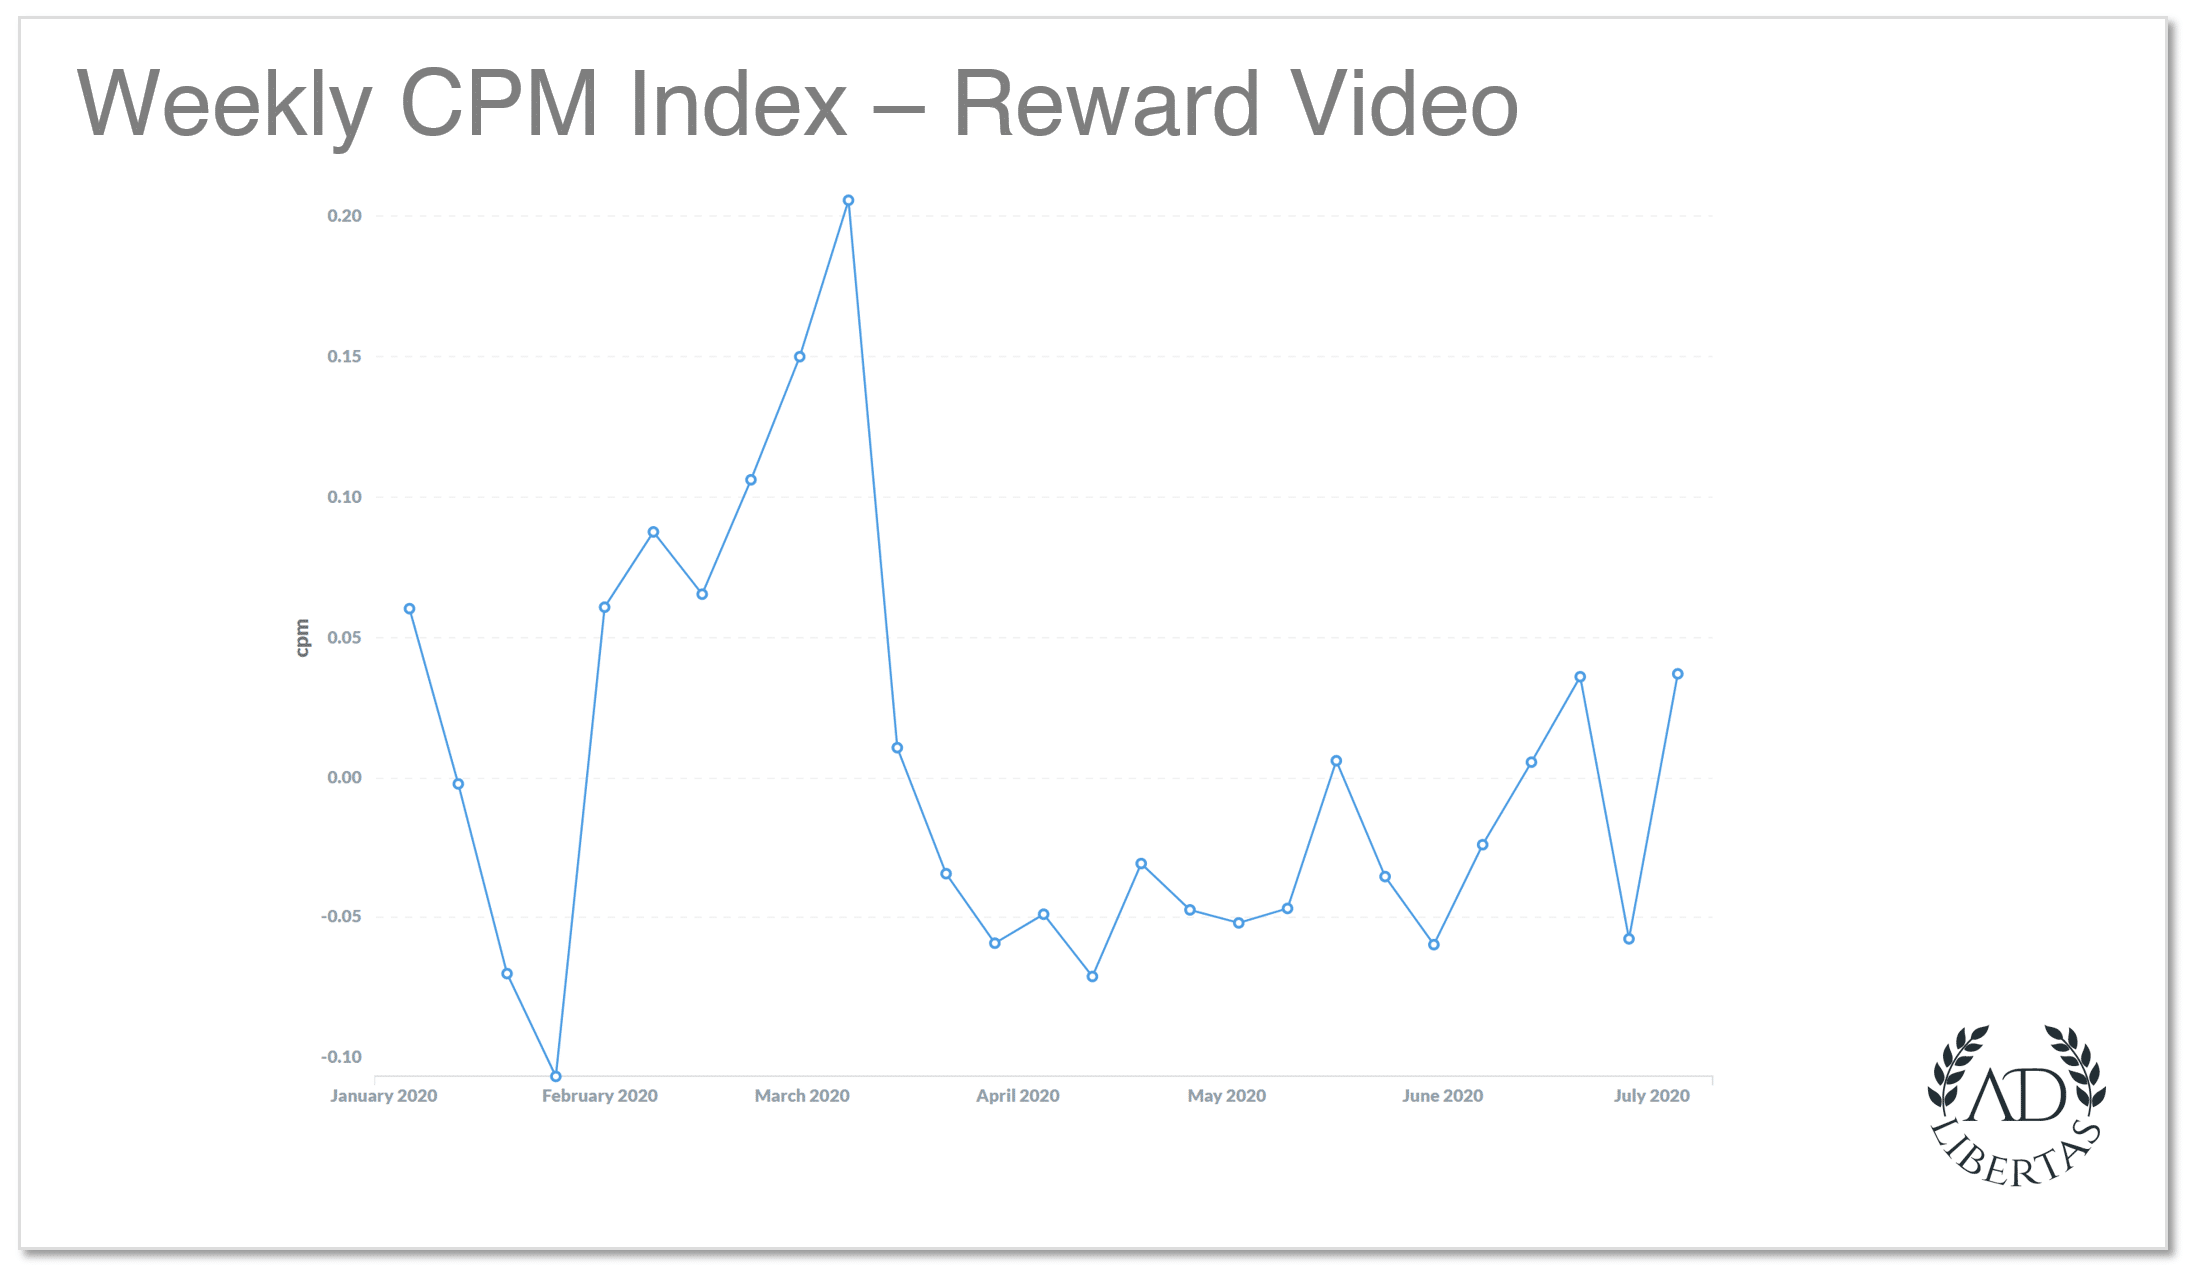
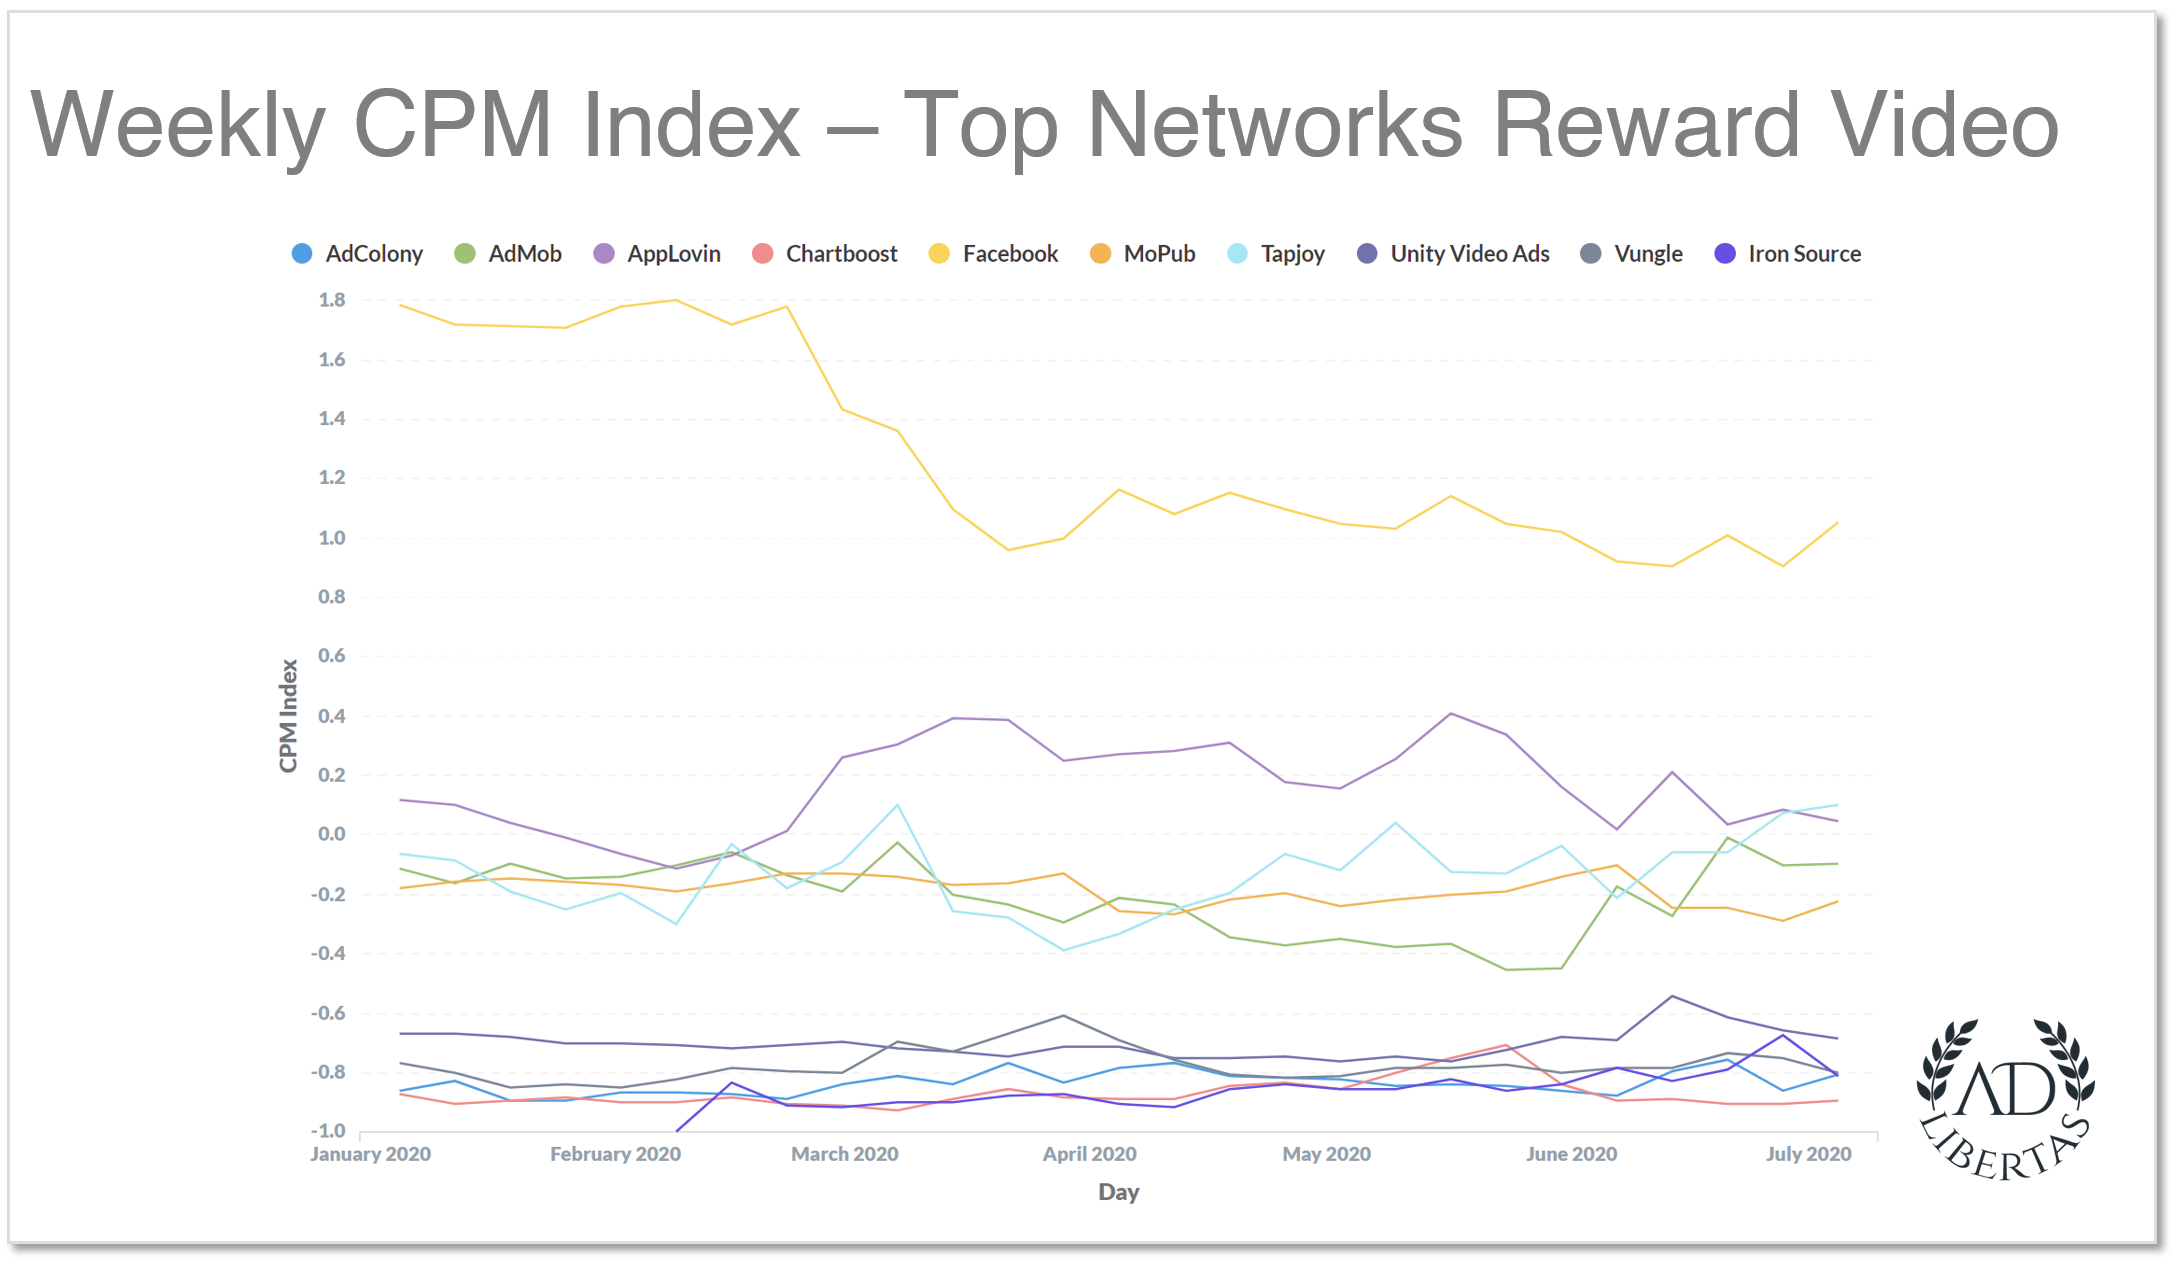
Reward Video CPM Index (by week)
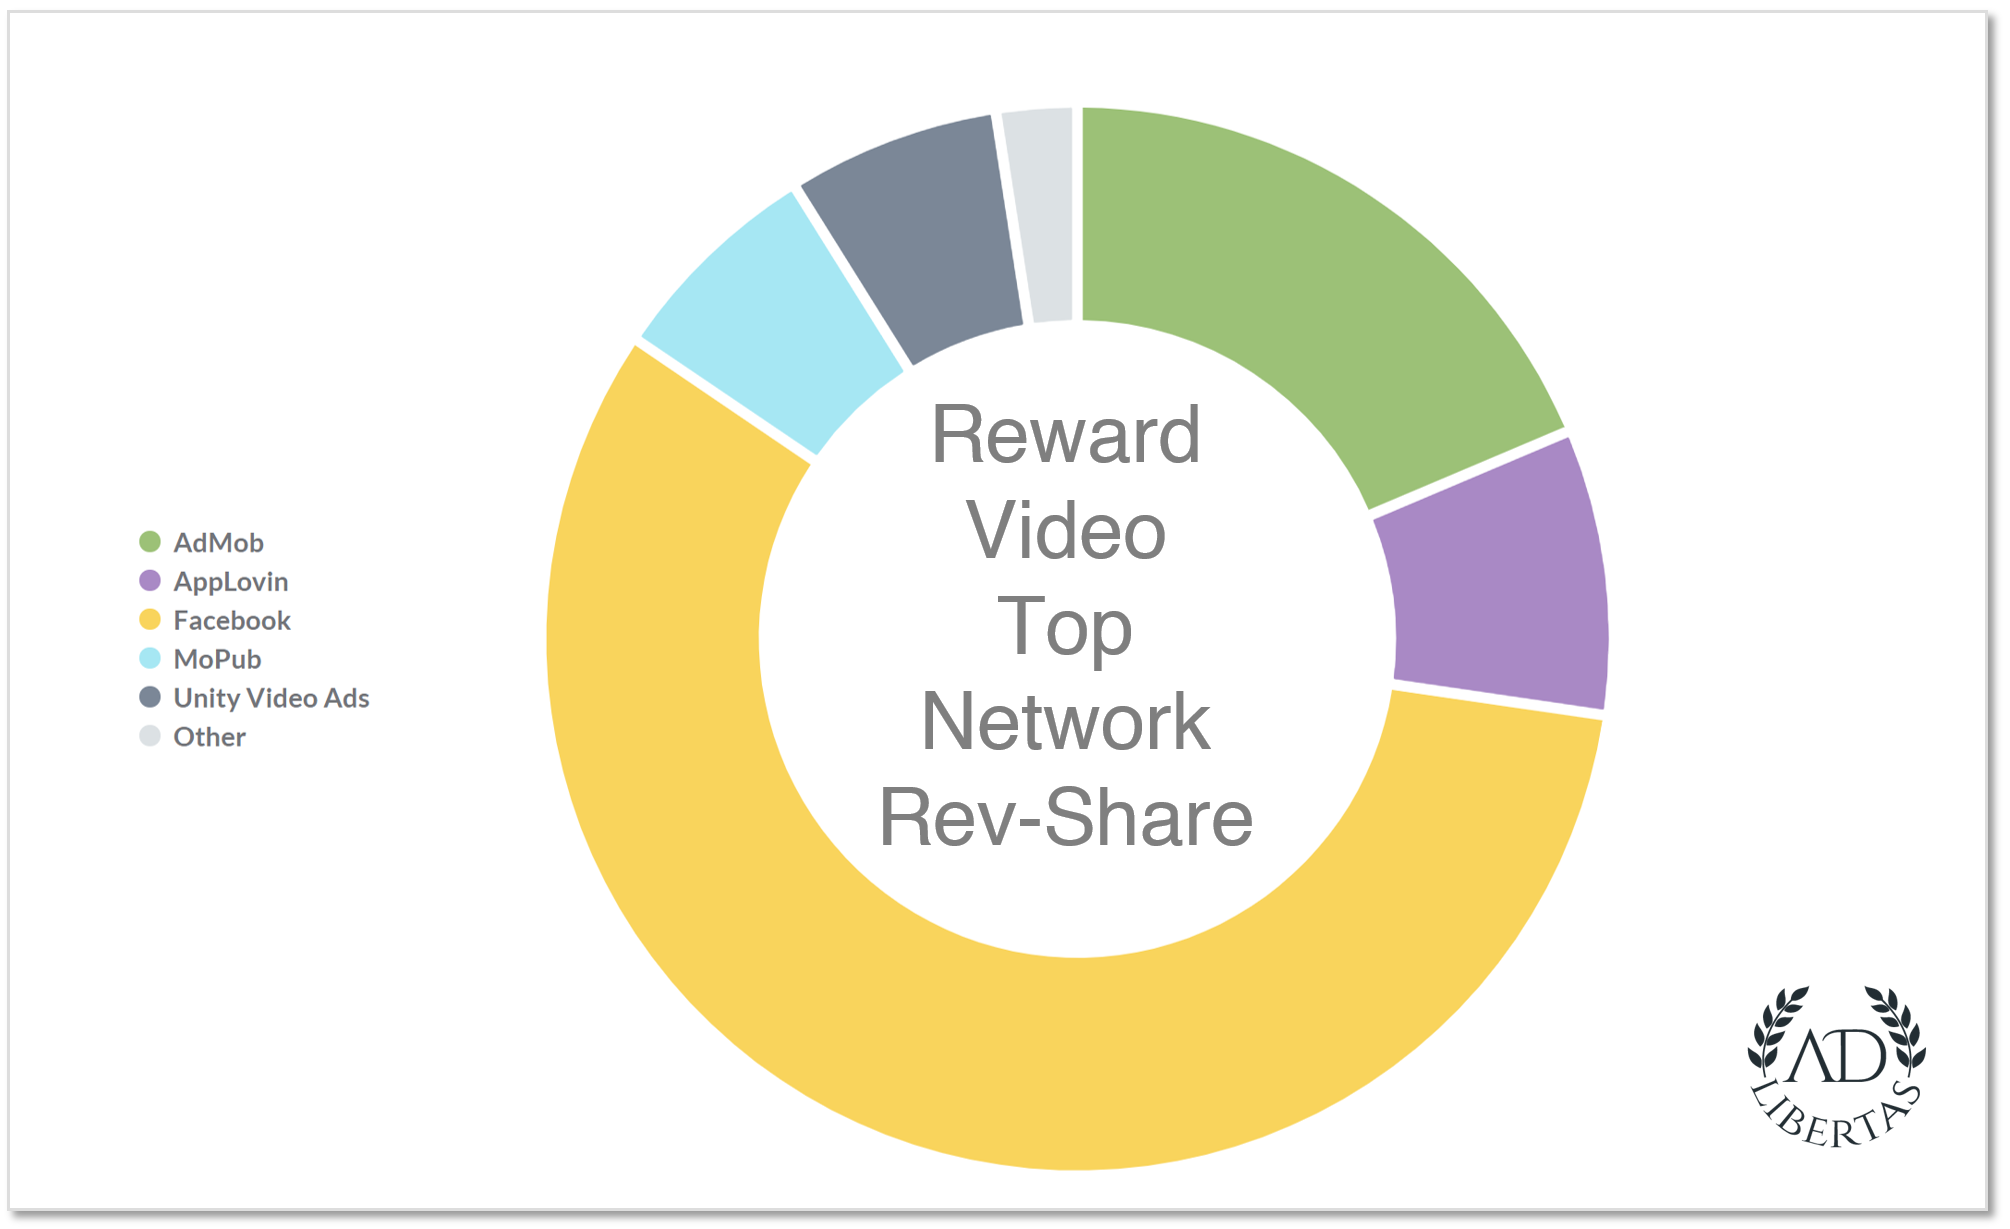
Summary: Hovering at average: Don’t let the swings fool you. At its worst, the Reward Video market dropped 5% during COVID. In an almost boring display of consistency, reward video revenue has maintained a largely-flat performance this year. And considering the uncertainty facing app developers this year, this “boring curve” is a blessing.
Previous Reading:
– Pre-COVID and Q1 CPMs discussed in our April 21st market-update.
– Daily CPMs continue to come back, mirroring the stock market’s recovery.
