Case Study: Can a user’s day-1 time predict their future value?

App developers are constantly looking to understand the value of a new user as early as possible. Whether that be to measure the success of an acquisition campaign, craft personalized app experiences, or simply understand the impact of changes, early prediction of user value can rapidly help app developers iterate on their app growth strategies.
To better understand a real-world use-case in how early predictions can be made — and how they can help growth– AdLibertas customer and frequent content contributor Geoff Hladik, Head of Strategic Growth for FlipaClip, decided to use day 1 user engagement time as a metric.
Geoff was generous enough to share his findings so others could learn from his experience.
How he did it:

Most analytics platforms allow you to track user-time. In this case, Visual Blasters uses Firebase, which allows you to add up milliseconds tracked in each event under the user_engagement_time of all user events, which AdLibertas User-Level Audience Reporting returns as time user’s spent in the app.
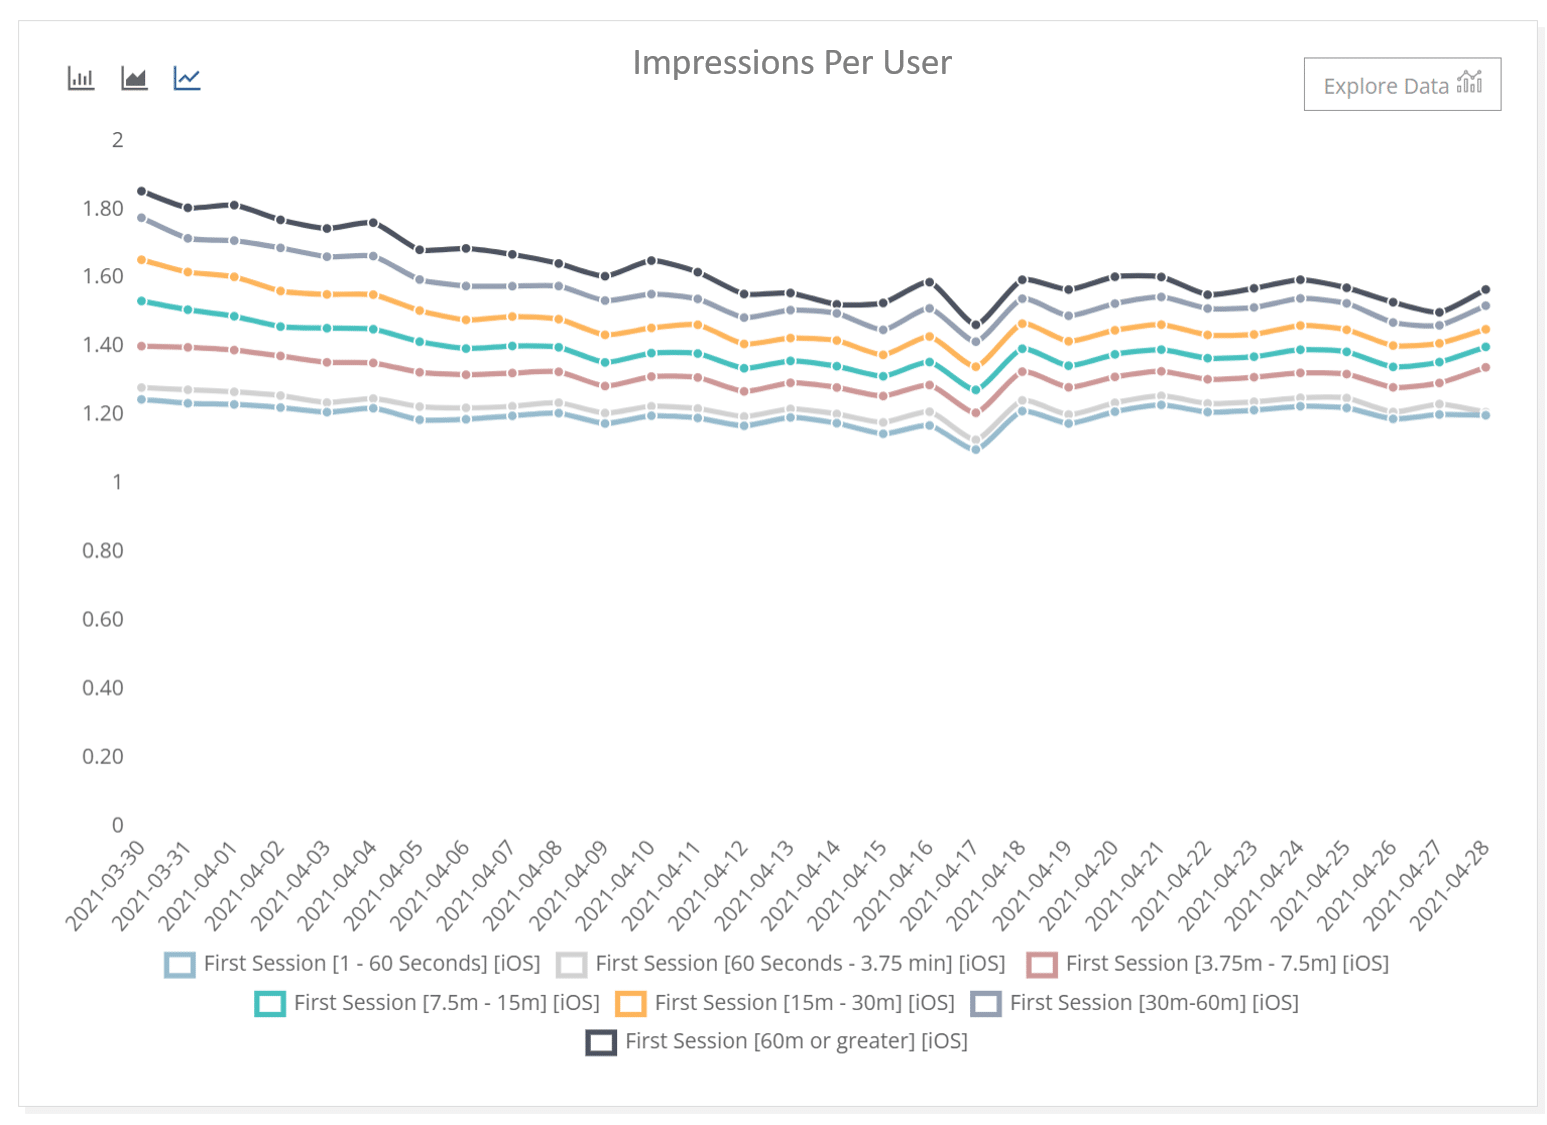
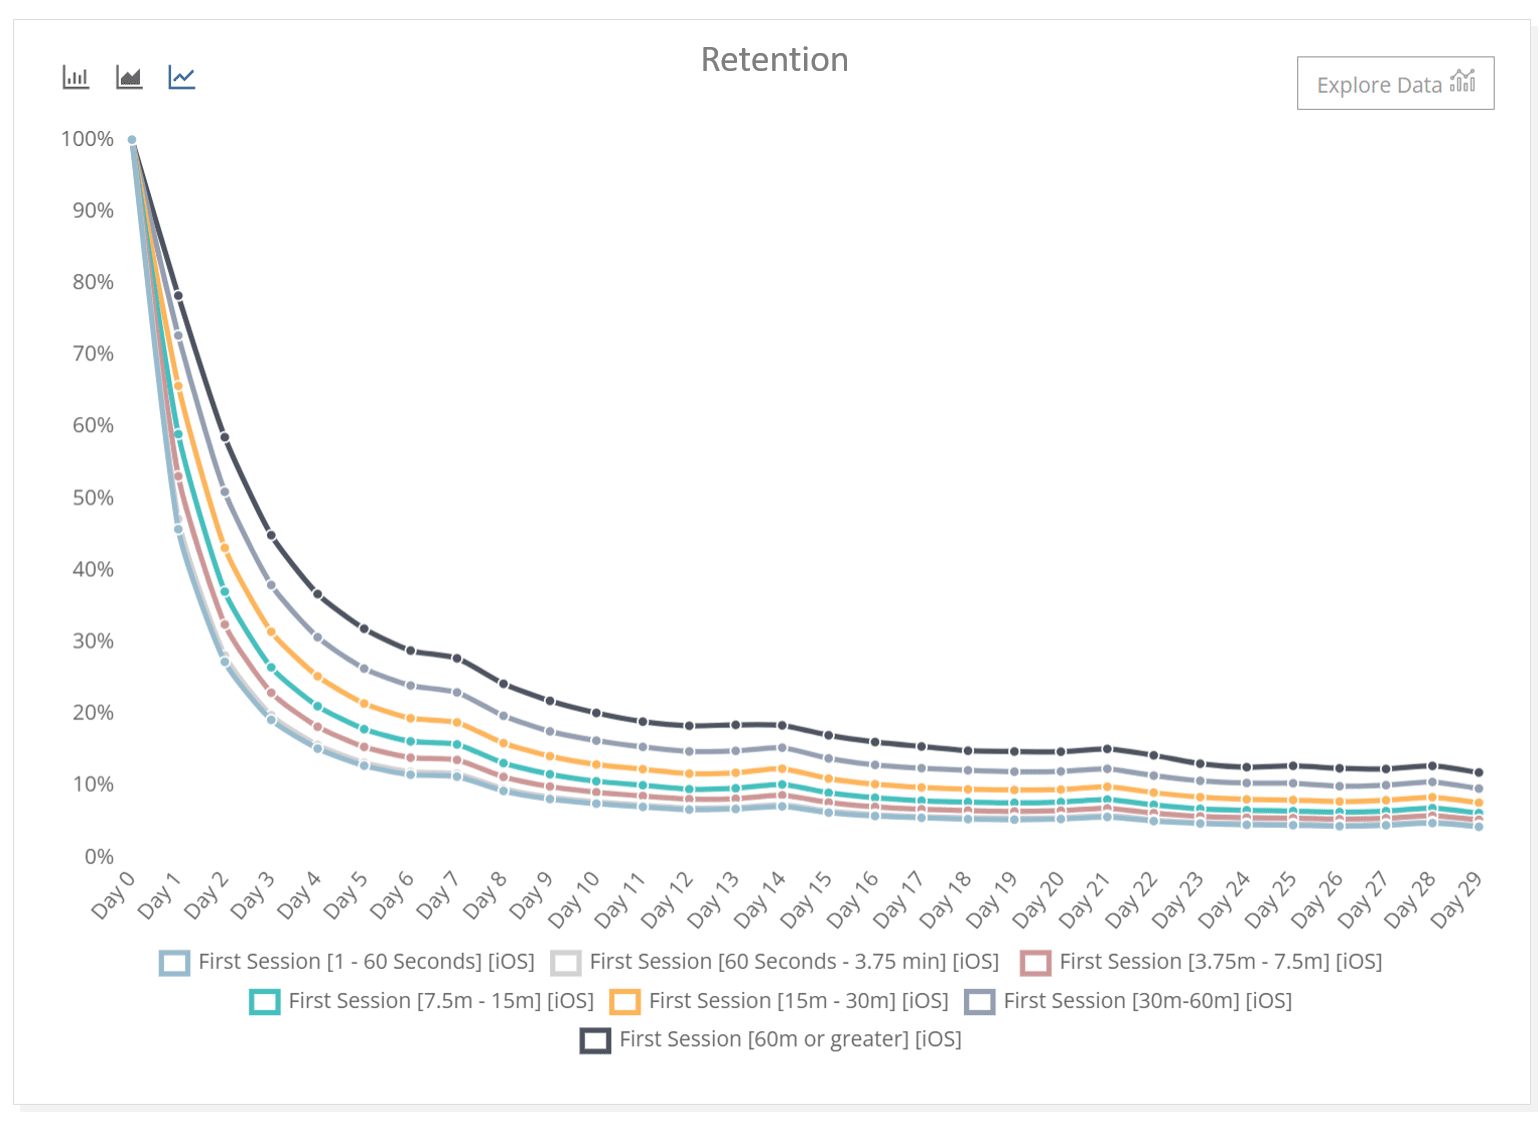
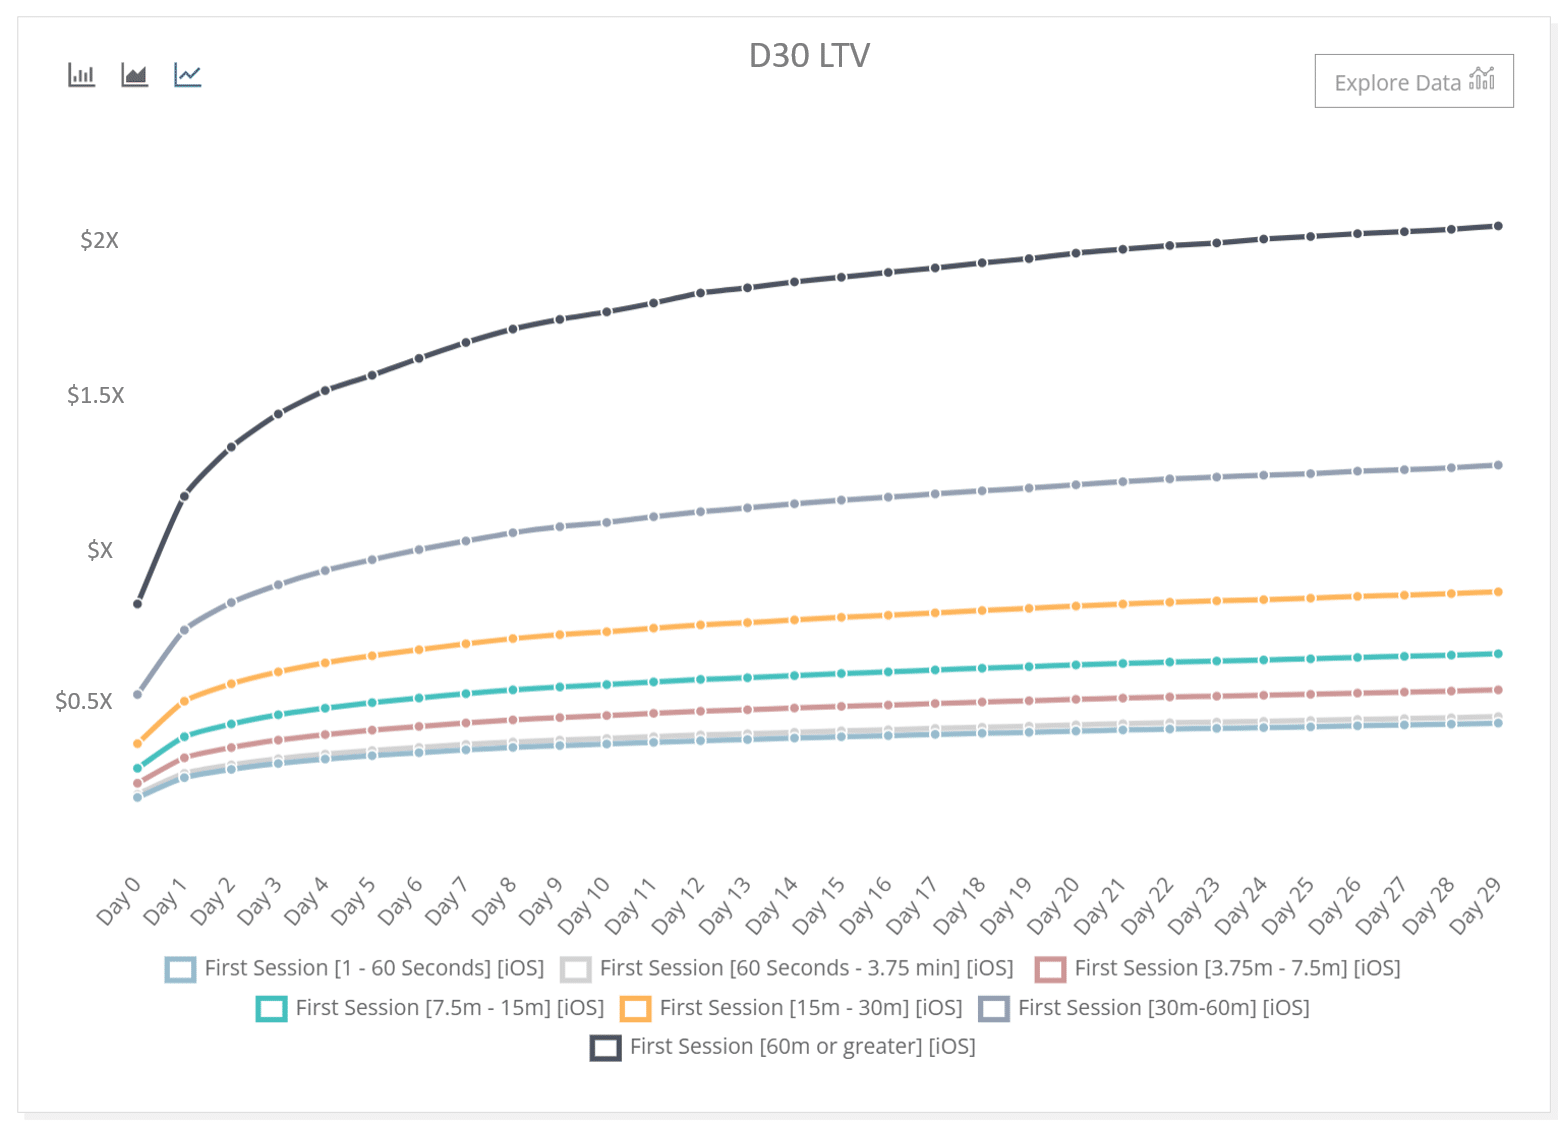
First Geoff created audiences – or segments of users – based on their engagement time on day-of-install (day = 0). By segmenting activity on the user’s first day, Geoff created buckets of users based on the amount of time they spent in the app. He created seven user-buckets. Then he created a report to measure each bucket’s performance over time. In this case he looked at the first 30 days of behavior, which can serve as a very strong indicator for future value.
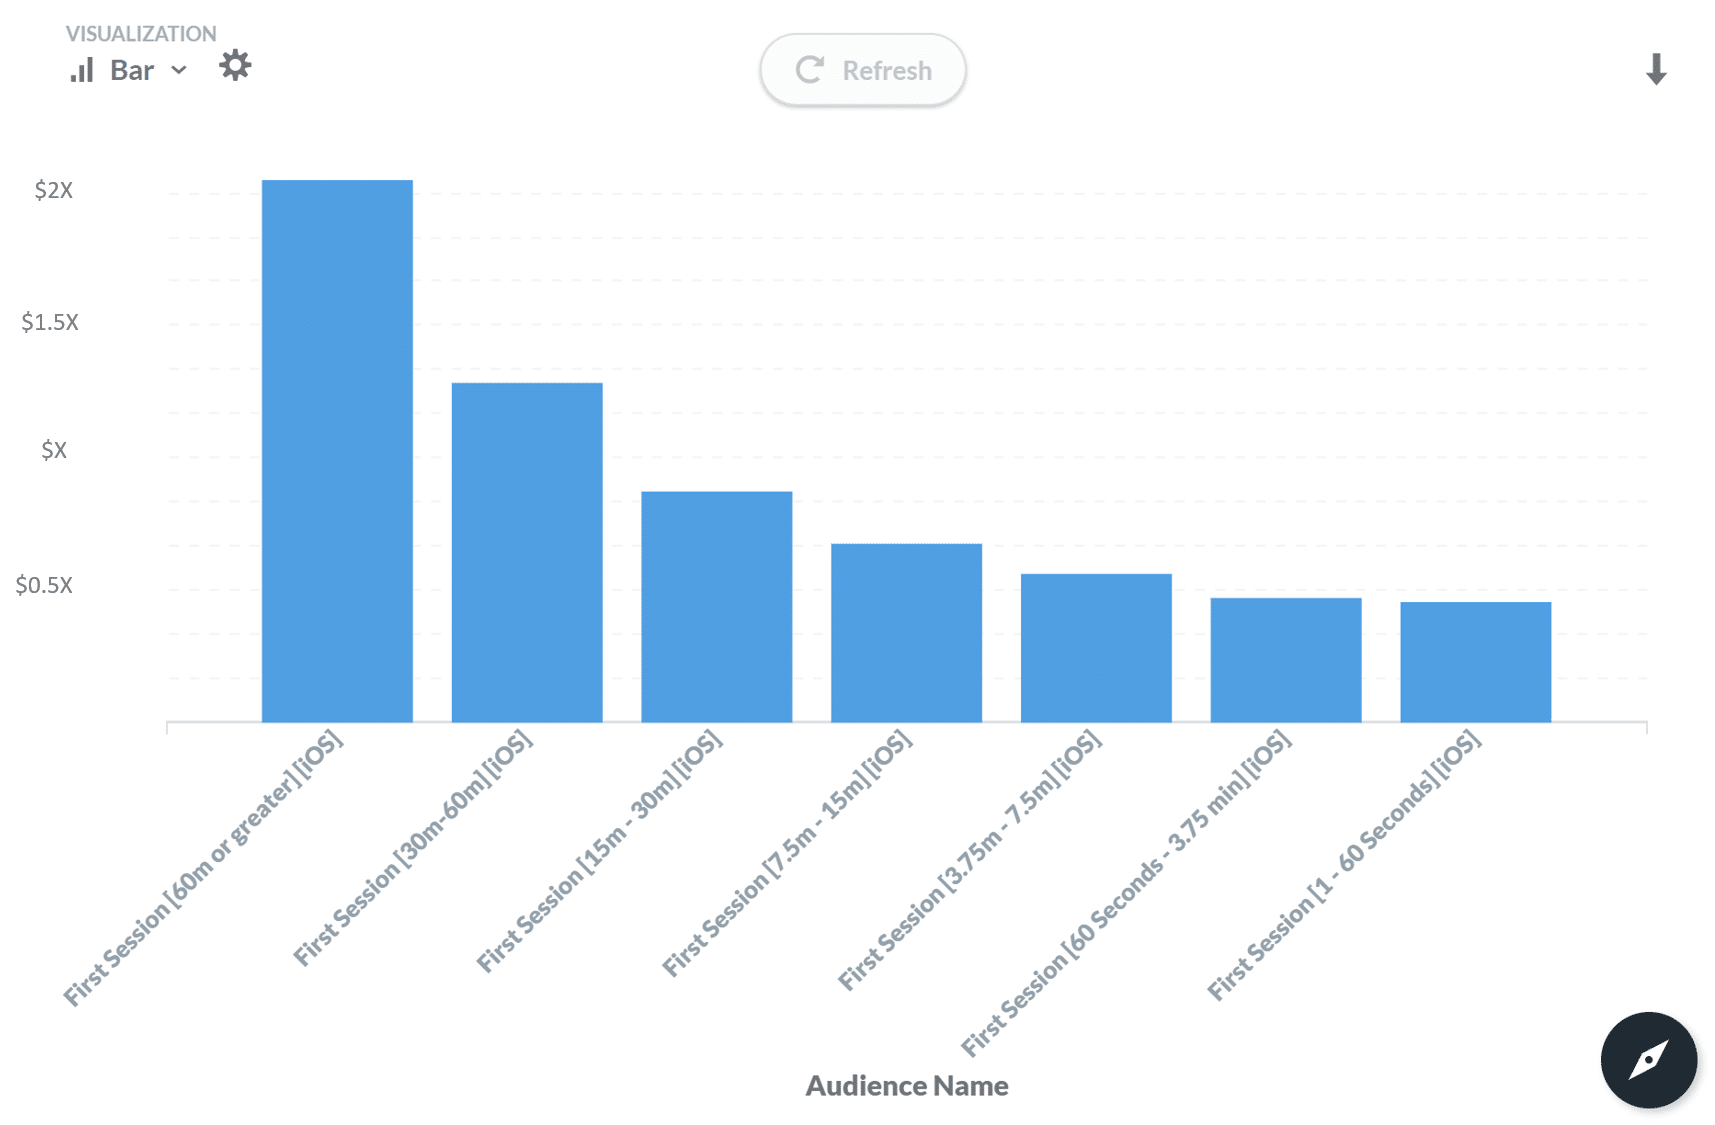
Seven buckets based on a user’s time spent in the app on their day of install. The buckets start at a users spending 1-60s during the first day, then proceed in increments with doubling time windows ending with users who’ve spend over an hour in the app on the first day.
The Findings:
You can see there is a very noticeable – and not terribly surprising — impact on user retention, engagement, and user LTV in the buckets of users.
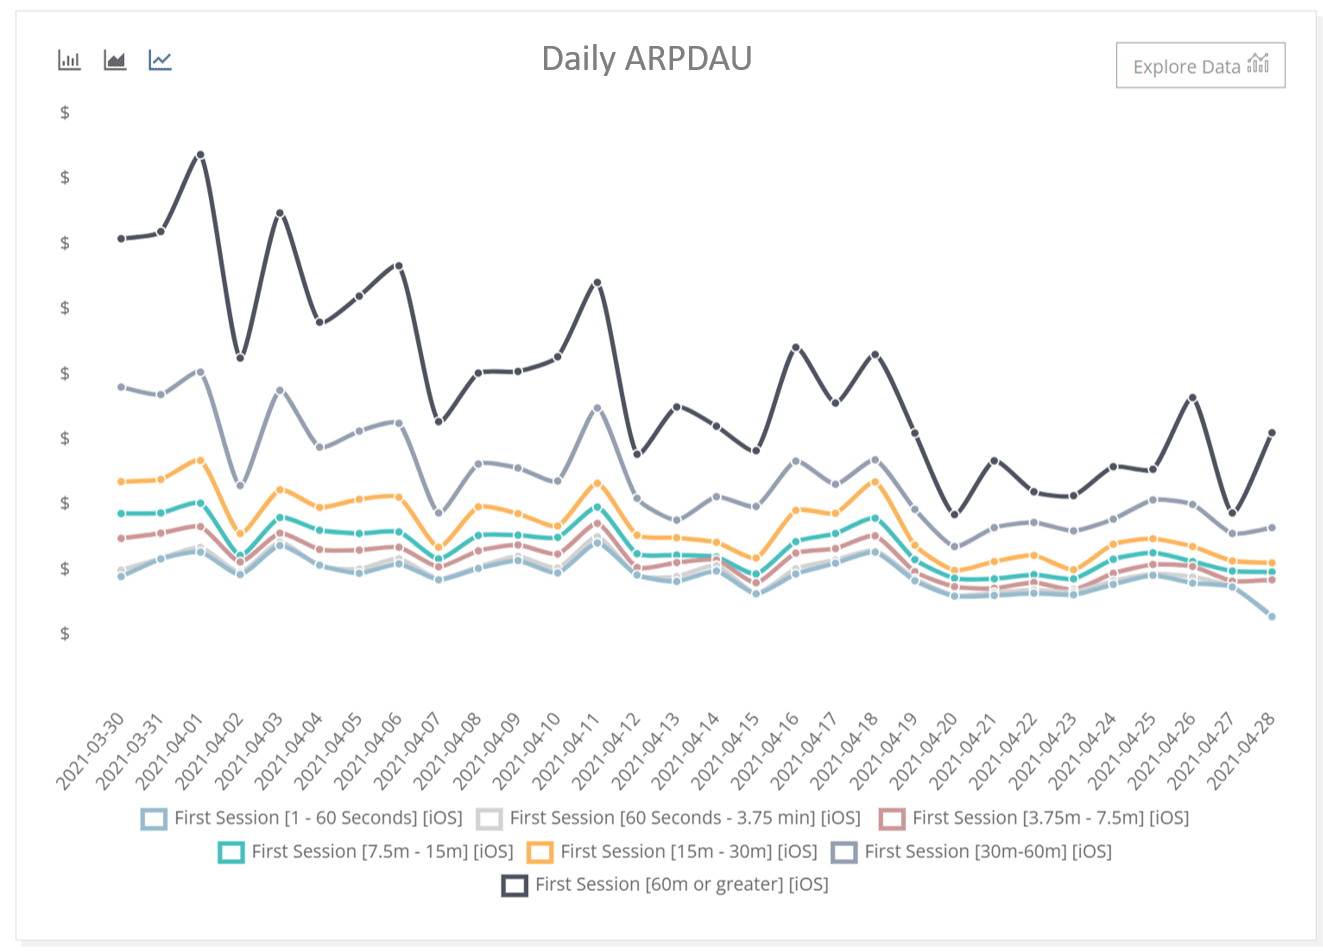
User’s who spend longer in the app on day one have a higher user-to-impression engagement (left), noticeably better retention (center), which all lead to a much higher LTV (right) as day-1 time increases.
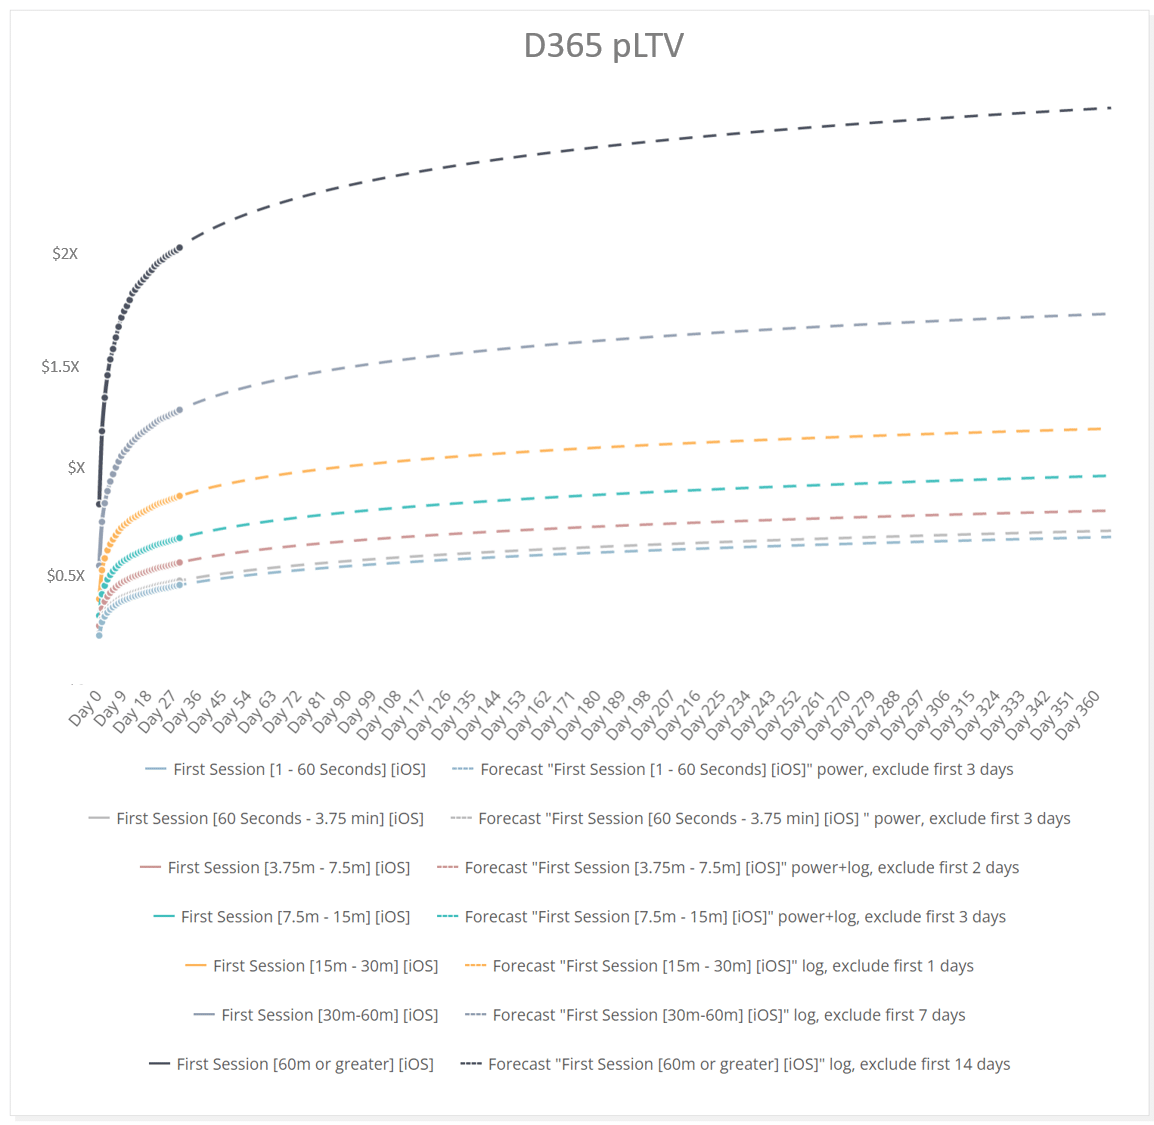
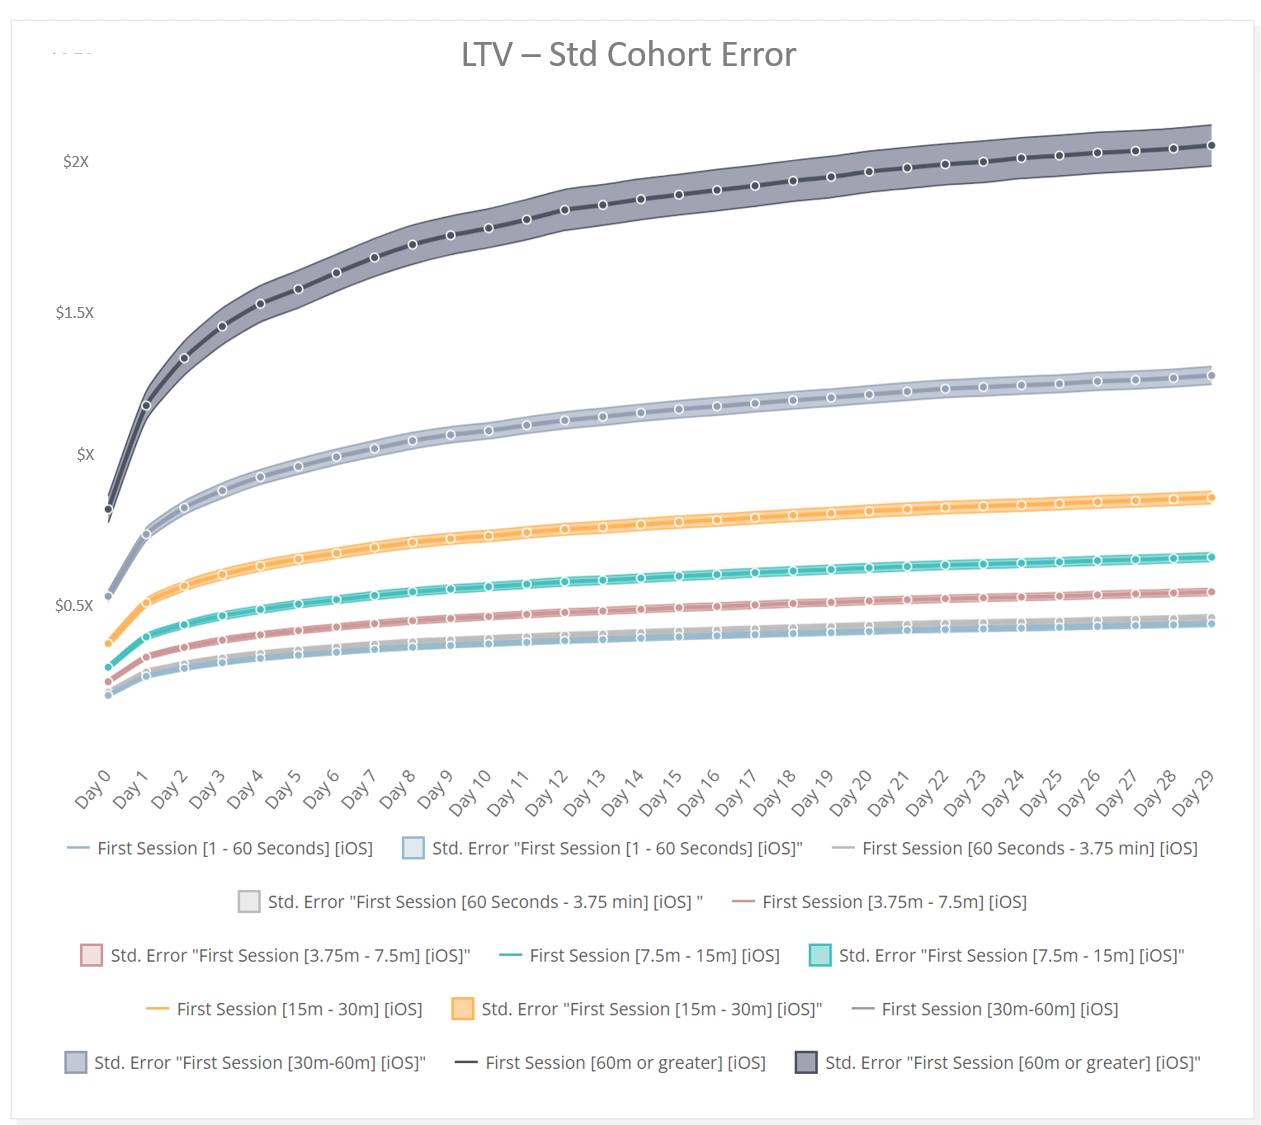
Day 30 LTVs show a (roughly) proportional exponential increase in LTVs as they relate to doubling time-spent-in app (left). Projected LTVs (center)show modeled d365 user value, and the standard error shows a relatively strong confidence for predicting cohort values (right).
What’s Next: Taking action on the findings
So what can you do with this information? Geoff has created three important actions from his findings of these users.
Marketing Success:
“We have a very strong referral program, understanding the value of users on day one is extremely valuable for us to focus on the campaigns and acquisition sources that are driving the most success. I now can use a campaign’s average user time on day one to get immediate predictions for future value.”
CRM for VIP users:
“Our users are very loyal, so we’ve implemented a reward program to incentivize and help their onboarding process. Knowing and engaging our VIP users early helps us focus on the retention and engagement of those high-value users.”
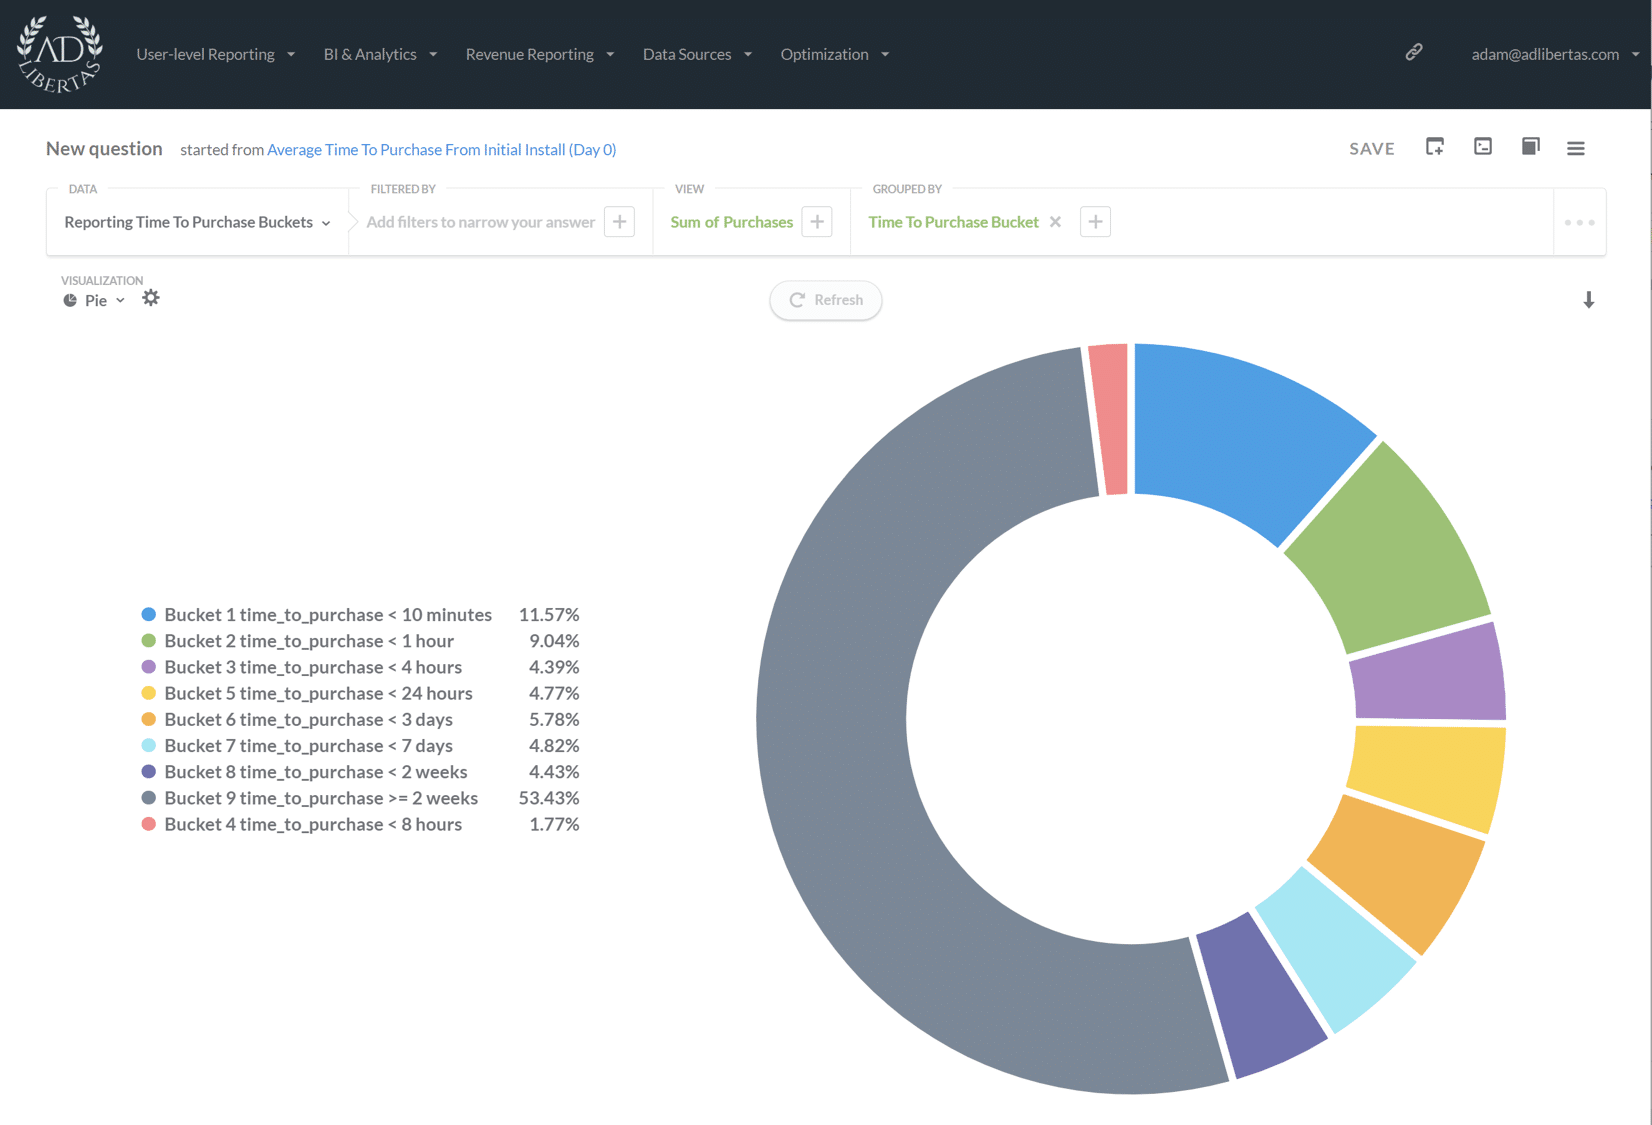
Understanding the user journey:
“Our monetization model is hybrid ads and IAP supported. One surprising and valuable outcome from this report was understanding when the users made their initial purchase. Half of our IAP conversions come within the first few hours to the subsequent few days of installation, with the remaining coming weeks to months later – which wasn’t what we expected. This shed light on the need to focus on the user onboarding to increase new users’ exposure to IAPs early, which represents a tremendous opportunity for increasing purchases and helping new users with early onboarding and engagement.”
