Statistics & Forecasting Modules
Introducing Statistics & Forecasting Modules
We’ve recently launched two new modules for User Level Audience Reporting, both designed to help better understand your audience and more accurately predict future outcomes (LTVs) of your measurements.
Video walk-through of how to use the statistics and forecasting modules (4:27)
The Forecasting Module:
Automatic user-level regression revenue projections
The Forecasting Module is designed to help marketing and product teams visually measure and predict the values of future audience LTVs. By using actual user-level data and earnings, you can apply revenue projection models that will factor in churn, engagement, and value for a group of users. While we’ve had projected LTVs for some time, this release vastly increases the number of projection models, as well as provides a best-fit feature for streamlining the projection process.
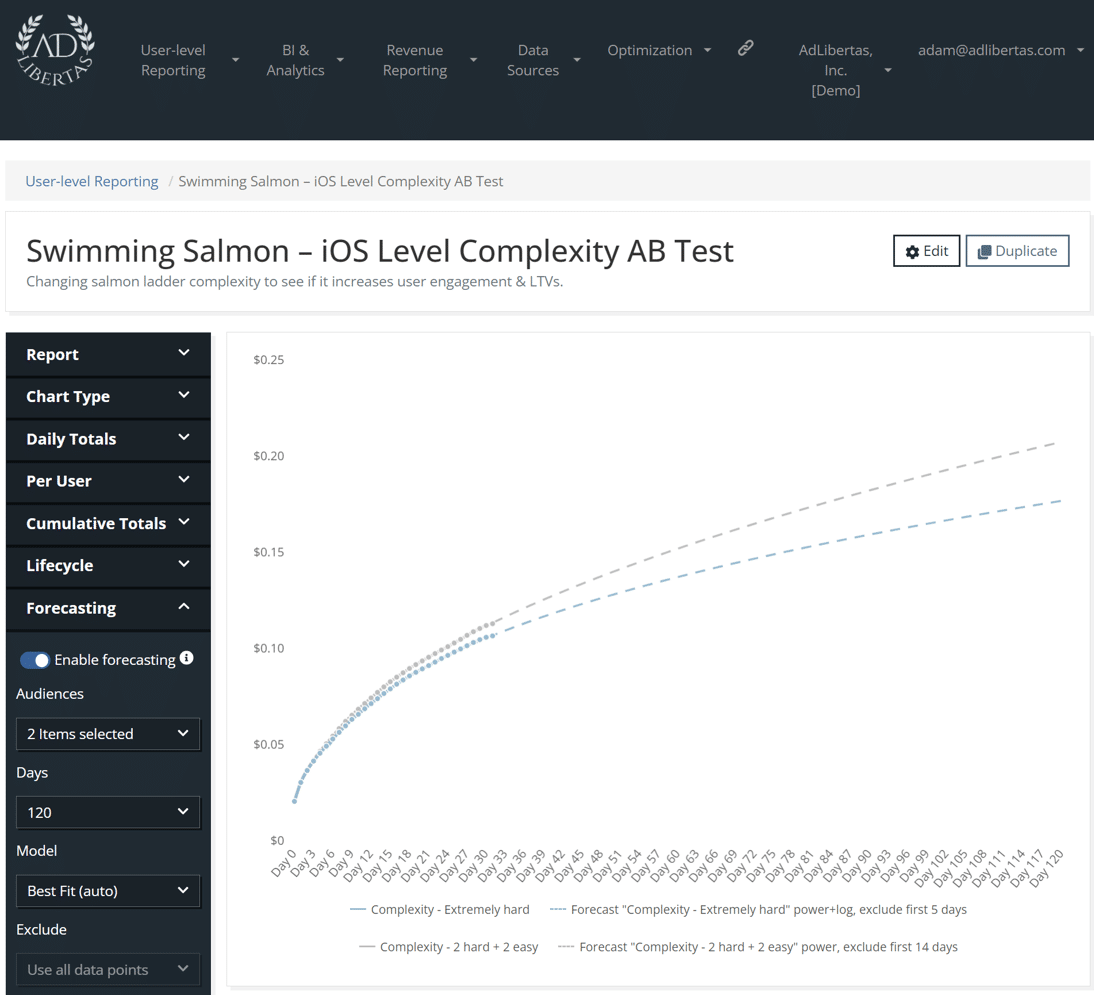
Auto-fit regression projections from dozens of mathematical models. In this example, we see the projected outcome of an AB test on day 120.
How it works
Once you’ve defined an audience and added them to a report you can use the Forecasting module to apply projections. By default, the system will apply the model that best fits your existing data but you can explore and refine among 65 custom-fit models that may better suit your needs. These projections are based on previous earnings and understanding the model that best applies to your app and users can give you insights to very accurate predictions as early as possible.
Use-case examples
AB tests: AB testing is a common method of iterating on an app to improve functionality or user engagement. Measuring the pLTV of a user’s outcome of a test combines their engagement, churn, and earnings – for many this is the gold standard for measuring the success of a test. To learn more, see this article as a theoretical example and this case study for real-world practical application.
Campaign Performance: One of the most straightforward applications of segmented performance predictions is to predict campaign performance as early as possible. The ability to apply projections over a large number of campaigns allows our customers to do campaign ROAS reporting at scale.
Behavioral user exploration: a common use case for AdLibertas customers is a better understanding of the value of users, either by their in-app actions or by their characteristics. Some examples are finding the value of a user’s performance on day-1 through actions or segmenting users by value, then giving them different user-experience.
The Statistics Module:
Understand how accurately your measurement represent individual performance
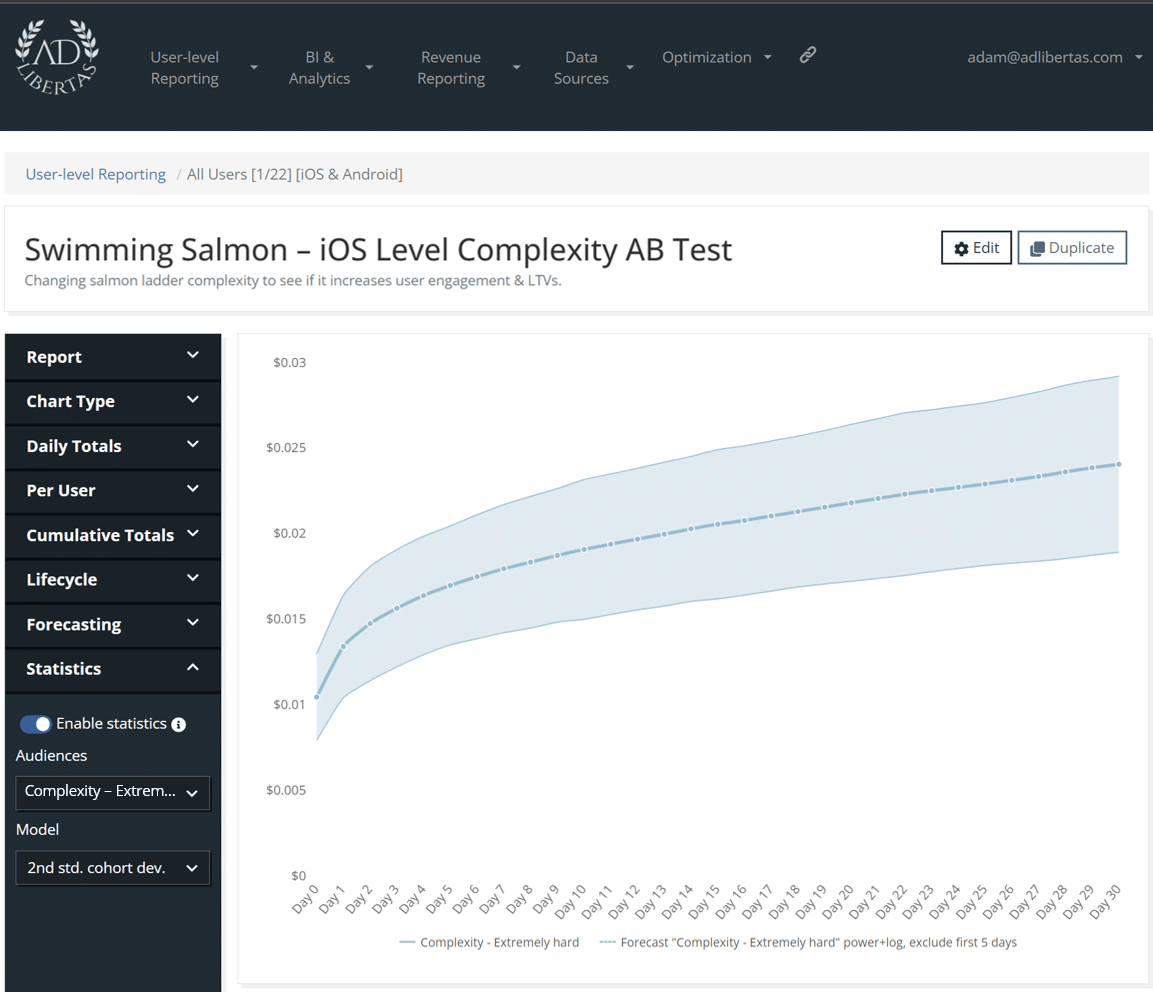
When dealing with large amounts of users, averages can be misleading. when making forecasts, a small number of uses may be required to predict the outcome of many. Both use cases mean it’s important to know the variance, precision, and confidence of your data to better understand the applicability of your measurements. For this reason, we’ve introduced the Statistics Module to give you tools to help you make accurate decisions.
How it works
For each audience and report, a variety of statistics are included on the performance of your audiences.
How it’s used
Confidence: Measures the statistical significance when comparing audience performance. The most straightforward example is when running AB tests, confidence will allow you better understand the validity and repeatability of your test findings.
Distribution: Measures the deviation of your user-cohorts. Understanding the dispersion of your cohorts will help demonstrate how widely individual cohort values can deviate from your average.
Error: The standard error allows you to understand the margin of error you should consider when looking at a sample cohort. Simply put, higher errors will make it less likely a subset of users (a sample) will represent the overall mean.
