How to calculate the LTV of a user on their first day
First-party is a hot topic among huge app companies: billions of dollars are being spent on consolidation and domination strategies by some of the biggest companies in mobile apps. A data strategy may feel ethereal and out of reach for a small indie app publisher. But this isn’t the case. In fact, it’s easier than ever to leverage your data to make intelligent decisions to help with your app growth and performance.
Today we’re walking you through how any app developer can quickly and easily predict the lifetime value (pLTV) of a user on their app on the first day without needing to invest in a data scientist or hire a full-blown data team.
But first, how will learning day one pLTVs actually help you grow your app? Early predictions of user value help in two main areas of app growth: acquiring better users and designing a better user experience.
Acquiring better users—by estimating the end-value of newly acquired users from a specific acquisition source – like a campaign— you can use that information to track effectiveness, ROI, or targeting and quickly iterate to make better, more profitable, and effective campaigns.
Designing better app user experiences – finding early, valuable users by their actions in the app will allow you to drive changes in your app to increase overall effectiveness, or to encourage users to increase app engagement.

So how does one estimate the full lifetime value of a user? Predictions are made by grouping a subset of users, analyzing their past behaviors and performance and making extrapolations about their future. This is easier than it sounds: you’re simply looking to (1) align your data, (2) identify a subset of users, (3) measure and compare historical performance and (4) make a prediction about their future value, then (5) use these findings to drive growth.
We break these steps down in detail.
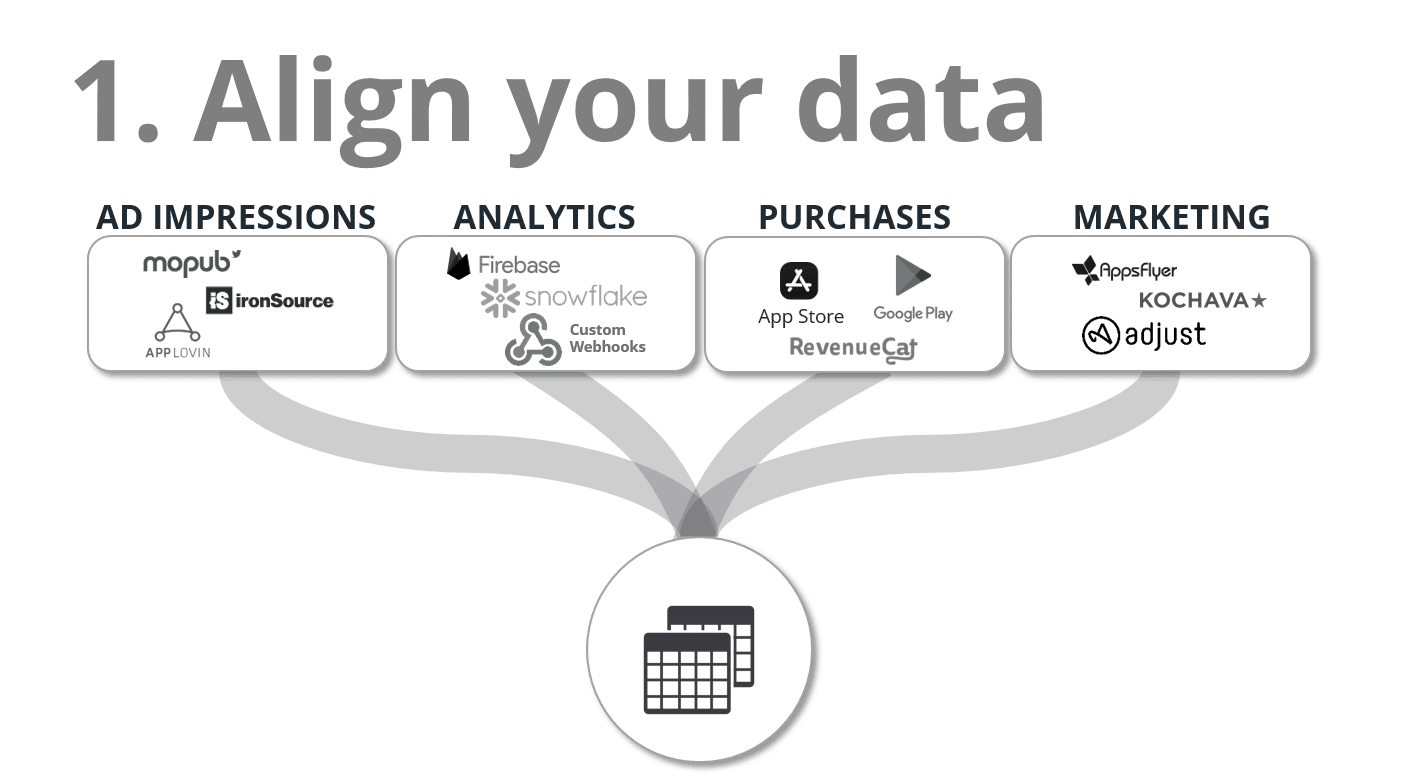
Step 1: Getting the proper data aligned
To get the day 1 activity, you’ll need to collect user behavior and characteristics the user generates on day 1. This could be as simple as install source (campaign), day 1 user actions (analytics), or simply their location. Second, you’ll need to collect the historical revenue earnings (performance) for these users.
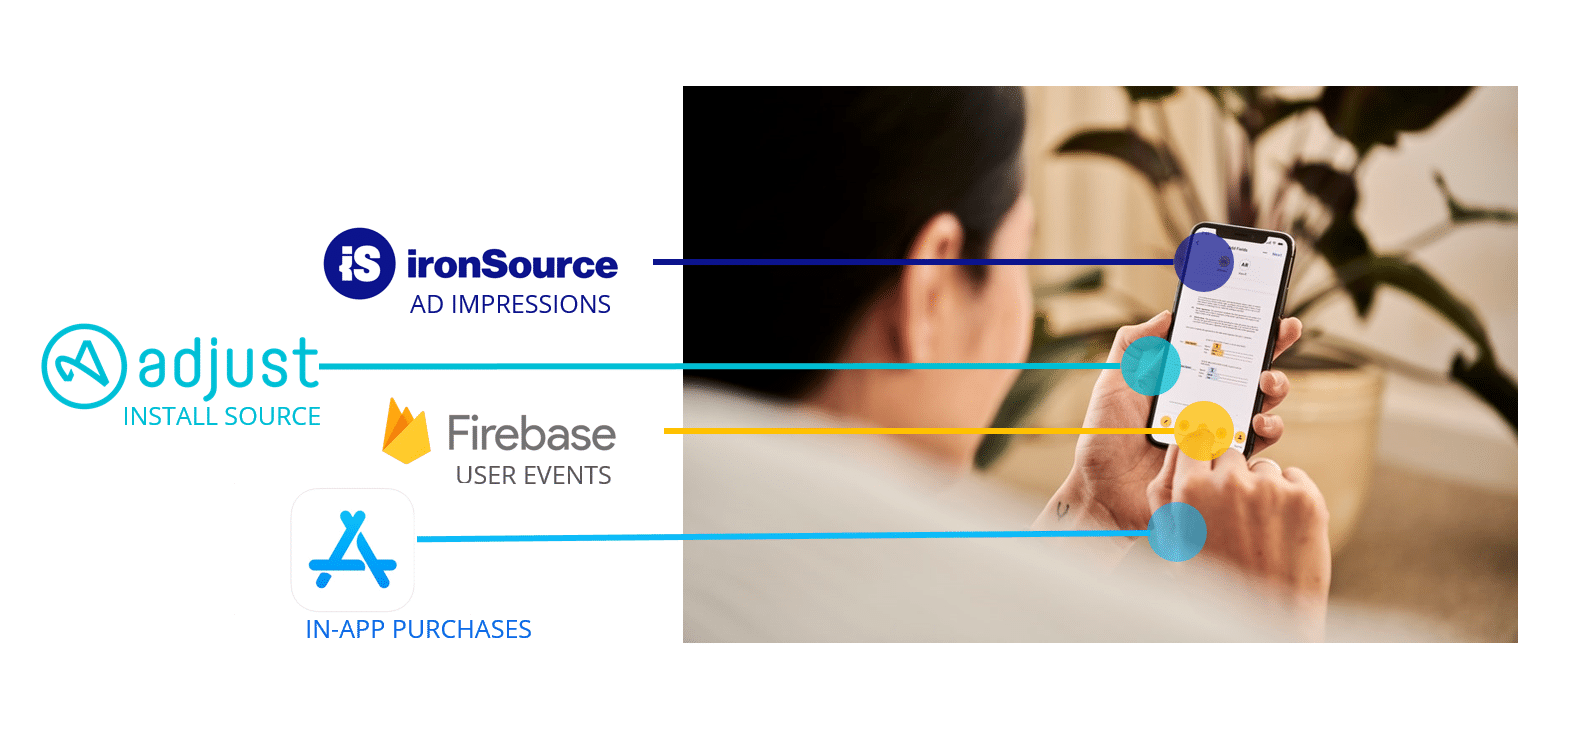
There are three main challenges with this step: (1) choosing a key identifier to align all sources of data, (2) combining the data in an accessible way, and (3) dealing with the scale of this dataset.
1. A key identifier
The key identifier allows you to link actions, events, and properties across different providers to a single user identity. The term first-party data refers to data you collect about users on your content (app). Some companies have a custom user-ID they assign users, but most simply rely on vendor-supplied identifiers. For iOS, this was historically the IDFA – but that identifier exists for such a small subset of users these days – we recommend the IDFV which will stay unique for all users across all of your apps. The downside is you can’t retarget these users outside of your organization. For Android, we recommend using the GAID as that’s still prevalent on a large number of users.
2. Combining the data in a meaningful way
Unfortunately across the many data providers, you’ll need to juggle different formats and methods for accessing the data. This will likely mean some investment in APIs, ETL processes, and other unification methods. An example is Firebase, which exports user events as a JSON object vs user-level revenue which is stored a flat file, and in-app purchases which are often collected as webhooks.
3. Dealing with scale
One-off SQL joins might work for individual queries but for many app developers, the scale of user-generated data starts to get unwieldy. And expensive. We’ve covered data pipeline architecture in past articles but we’ve seen many innovative ways to solve this challenge at scale and remain cost-effective.

Step 2: Identify a subset of users.
Here you’ll need to choose and define the users you want to measure. This will be users grouped by their day-1 activity for use of historical performance and predictions. Not all apps will have the same grouping, your idea here is to start with a hypothesis on how you can differentiate users in your app, then measure to validate. You have four considerations when creating create user subsets:
Actions and Events:
These are activities taken by users on the first day. Some groupings we’ve seen:
– Users finish 10-puzzles on day 1, with the idea this will be an indicator of an engaged user
– Users who opt-in to ad-tracking will likely be more valuable than those who opt-out.
– Users who complete a tutorial will have better retention than those who skip the tutorial.
Characteristics:
Characteristics: Also called “user properties,” these aren’t individual actions, but rather “lasting” details about the user:
Geo: Always an important one, geography can be an important indicator of future value. Example: the United States vs Russian users.
Device Type: iOS vs Android is the highest level but even different phone models can be accurate predictors. Long ago I worked with an innovative advertiser who found 10x value on users with the latest iPad– they had found the ROI on these users to be extremely valuable and a subset worth investing in.
App/OS Version: We have quite a few customers who measure app version user performance and retention to ensure no IAP or ad logic is broken between releases.
AB test: many app developers apply AB tests to users, these are usually stored as a user property.
Origin/Campaign:
For marketers, this is the most straightforward. Quite simply these are users bifurcated on where they are referred to the app. Depending on your campaign granularity and volume, this can be combined with user action and characteristics:
Campaign Source: The highest level of a campaign (Google CPC ads, Unity installs)
Site/App-level: For higher-volume/budget UA campaigns you’ll break down by site, app, and geo to further track performance.
One note on user grouping is to ensure you have enough users: This is a subjective number. You’ll need to ensure you have enough users to make a reliable, repeatable measurement – the significance will depend on the volume of users and the comfort level of your understanding of users.

Step 3: Measure and compare their historical performance
Once you have defined users, you’ll need to find and measure their historical performance over a timeframe. While straightforward sounding, this will ensure you tie in ad revenue, in-app purchase revenue, and subscription revenue for each user in your user subsets over a fixed timeframe to get a complete view.
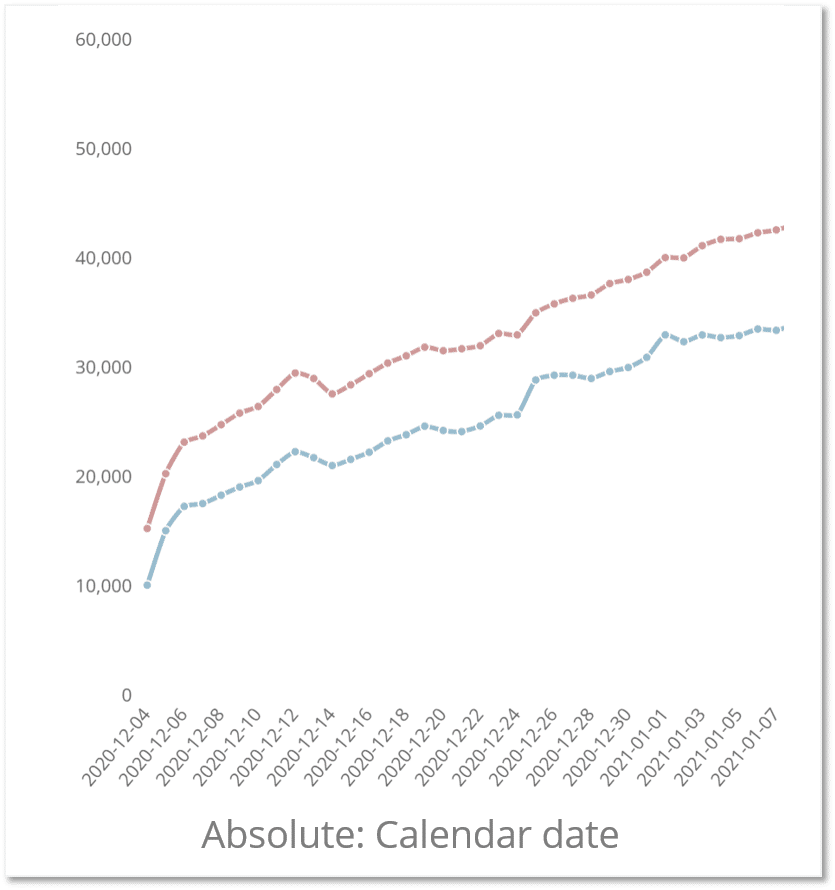
Absolute report
The most common way to measure and compare users is over a fixed timeframe (we call this absolute reporting). This will allow you to compare the selected metric performance of your selected users in a particular timeframe. Some examples:
– User CPM by date
– Puzzles completed by day
– User earnings by day
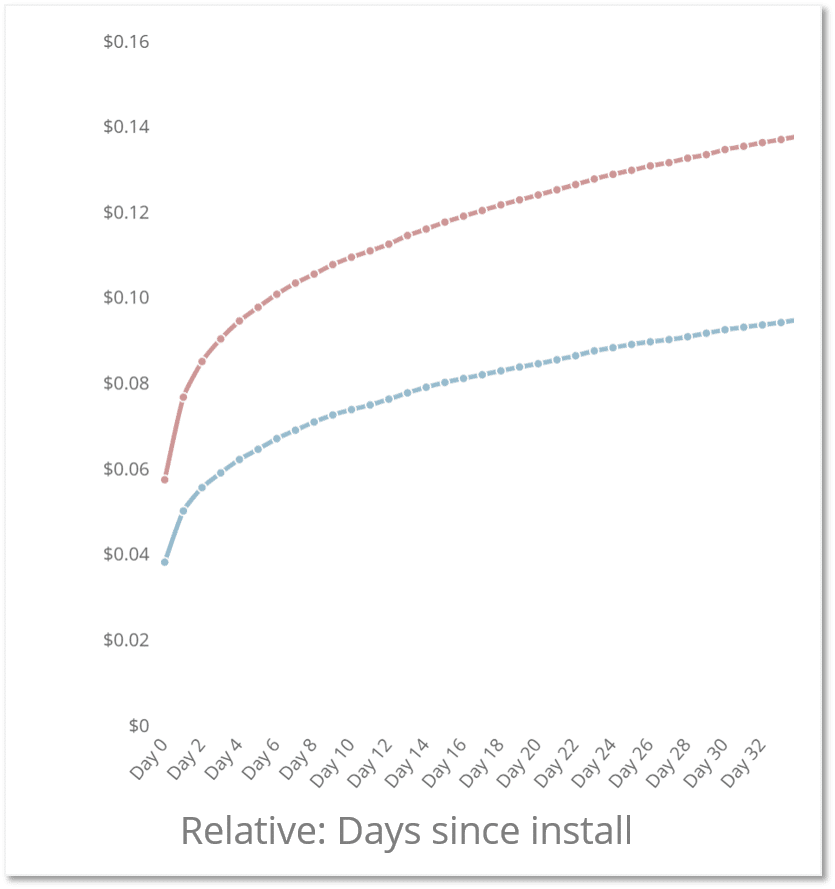
Relative (cohort) reporting
A more advanced form of measurement you’ll find valuable is cohort — or relative reporting. This aligns users on the x-axis to the same install date and measures their metric performance against the time since they’ve installed, thus taking retention into account. The most obvious report in this format is LTV but we’ve found other cohort-KPI measurements valuable as well.
The reports themselves can be powerful in finding out when during the user journey an event or purchase happened. Often this allows you to better infer behavior or app usage characteristics that will help drive actions for your growth strategies:
– Finding users who complete a tutorial on day 1 are worth 50% more
– Users completing 10 puzzles on day 1 are worth 2X.
– Users opting into ad tracking are worth 5X more.

Step 4: Making predictions for the future
Don’t get wrapped up in complexity here. In most cases, a simple regression analysis is sufficient to make your predictions. Once you’ve outlined the LTV of your users, simply make your prediction: Find the mathematical model that best fits your data. Should you ignore the first 7 days of data?
See this article on choosing the best pLTV model that best suits your app users.
Once you’ve chosen your model, confirm your accuracy! Measure data from a month ago. Project earnings, on that subset, then measure against actual. Are you tracking true?

Step 5: Use findings to drive actions & changes
The last step is the answer to the (most important question): so now what? Day-one user value predictions are to help you guide your acquisition and app change efforts to the most successful growth strategies. While these are going to be highly custom to your app, users and priorities, here are some excellent suggestions we’ve seen:
Optimize onboarding: Visual Blasters learned onboarding was important to user retention, they increased encouragement in new-user onboarding process through house ads to increase user LTV 2X.
Encourage user behavior: After learning how important ad opt-ins were for his business Sebastian Hobarth increased pressure on users to opt-in. He doubled app revenue.
Identify Whales: Big Duck Games was able to identify 10X users on day one by finding a threshold of day-1 puzzles solved. They now use this event to drive the conversion values of their campaigns.
Predict campaign profitability: Random Logic Games uses user pLTVs to drive bid prices on UA campaigns.
Drive product changes: AB tests are the cornerstone to app iteration. By measuring the LTVs of AB tests, Alex was able to increase user retention and increase LTV 10% by finding better puzzle mechanics for his users.
In closing
While it may seem like data science is reserved for billion-dollar company elites the truth is there are mobile apps of all sizes leveraging day-1 predictions to drive user growth.
Correctly leveraged, your data will enable you to make these predictions. If you’d like to speak through how this could work for your stack, get in touch and we can walk you through how we’ve seen mobile apps leverage these powerful insights for growth.

