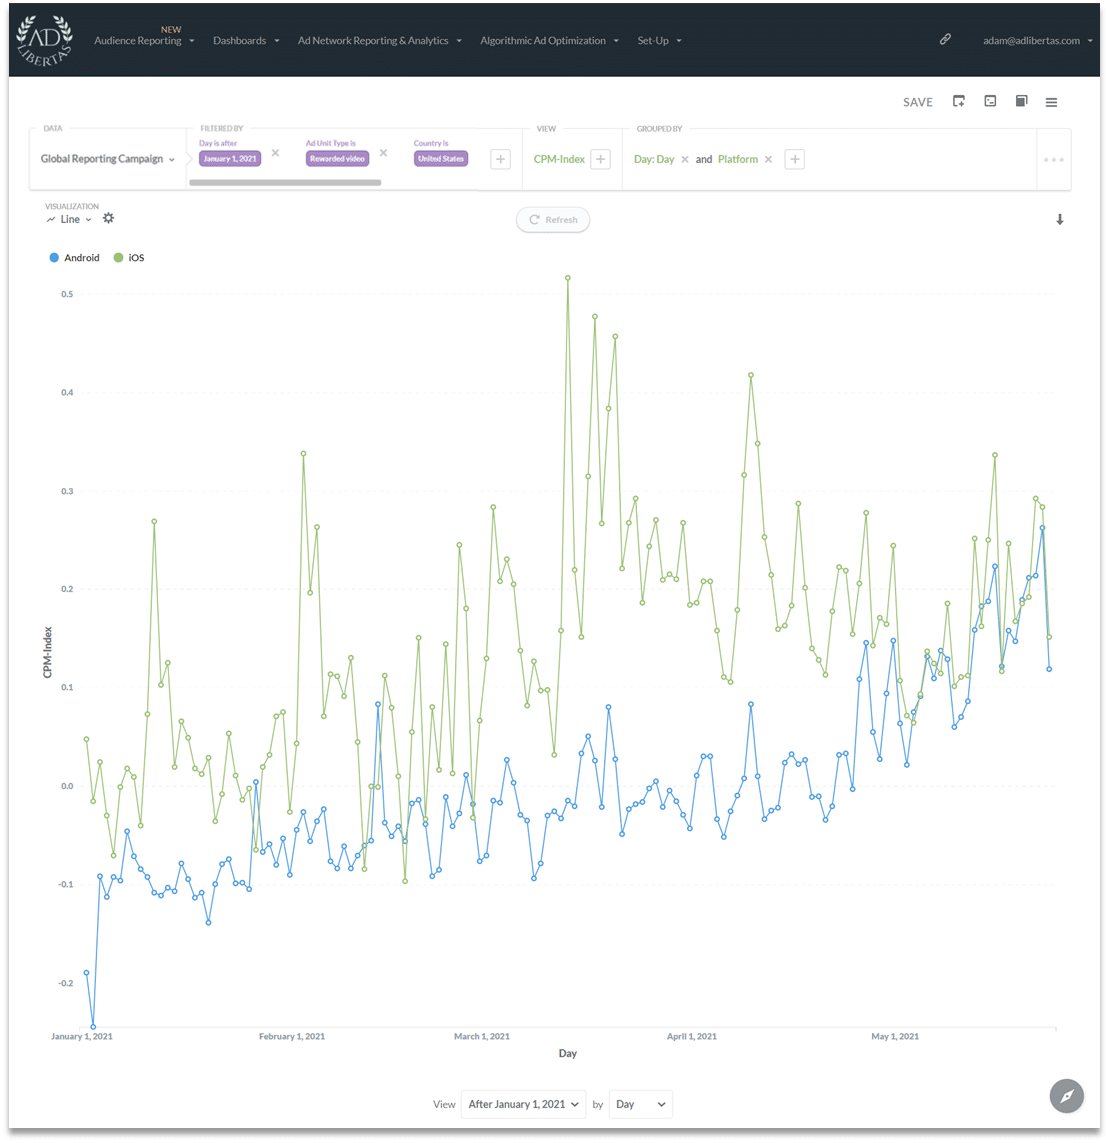
14.5 Rollout: iOS CPMs still down, Android climbing.
iOS CPMs remain down, Android seems to be picking up the slack. These changes signal significant impact on long-term user value (LTV).
A follow-up to our early-May post, we’ve refreshed global CPMs by platform and ad-type to give app developers an idea of the impact to ad earnings across the industry. As Flurry continues to indicate a slow roll-out and lower-than-hoped opt-in rate the impact of iOS 14.5 certainly seems to have made some impacts in ad monetization. Read on to see the indexed values and our takeaways.
Note: CPMs are listed as index values, therefore swings may be exaggerated (or minimized) based on normalized fluctuations.
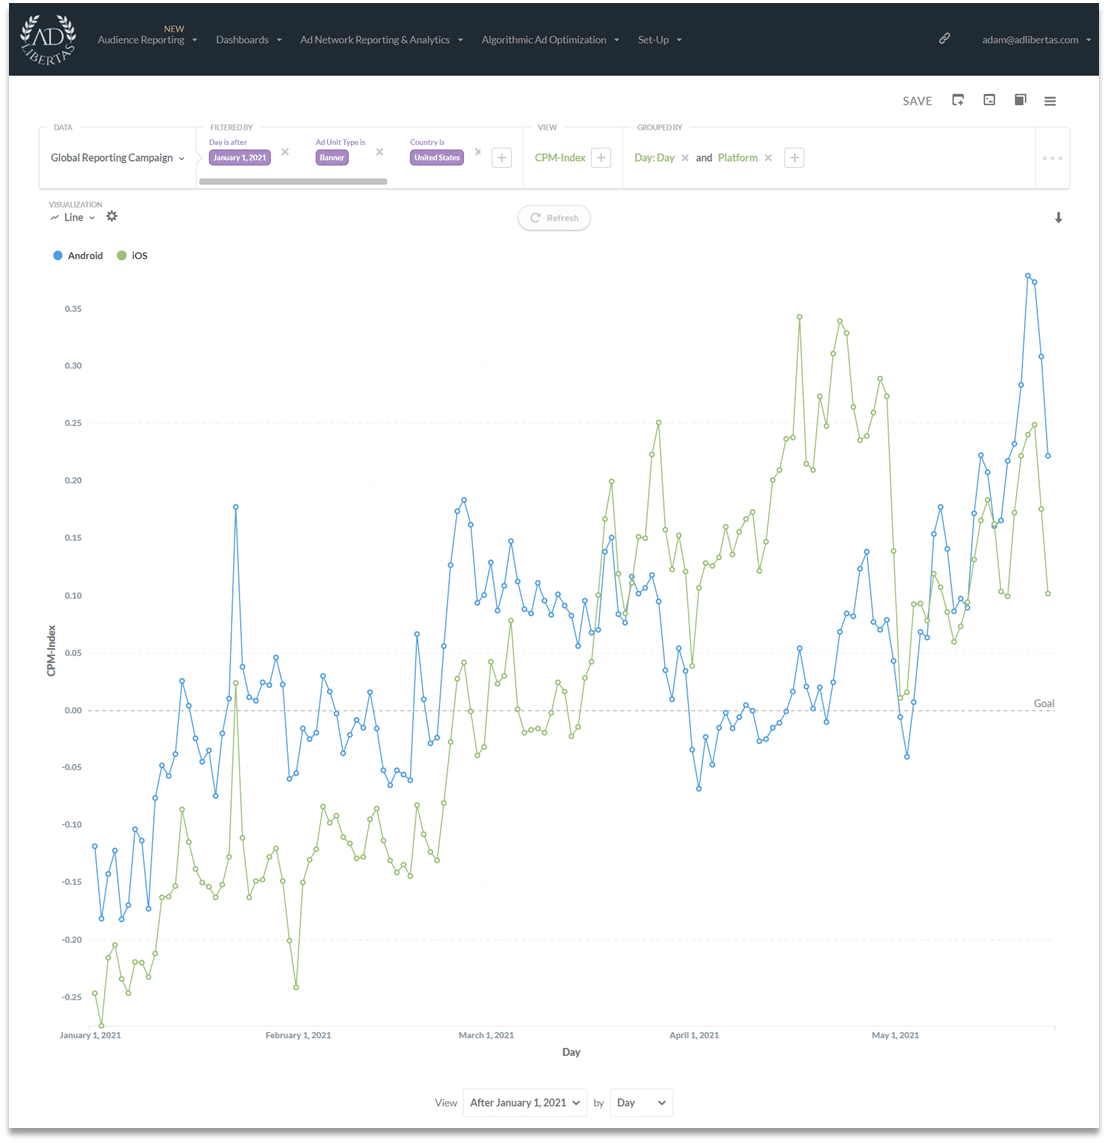
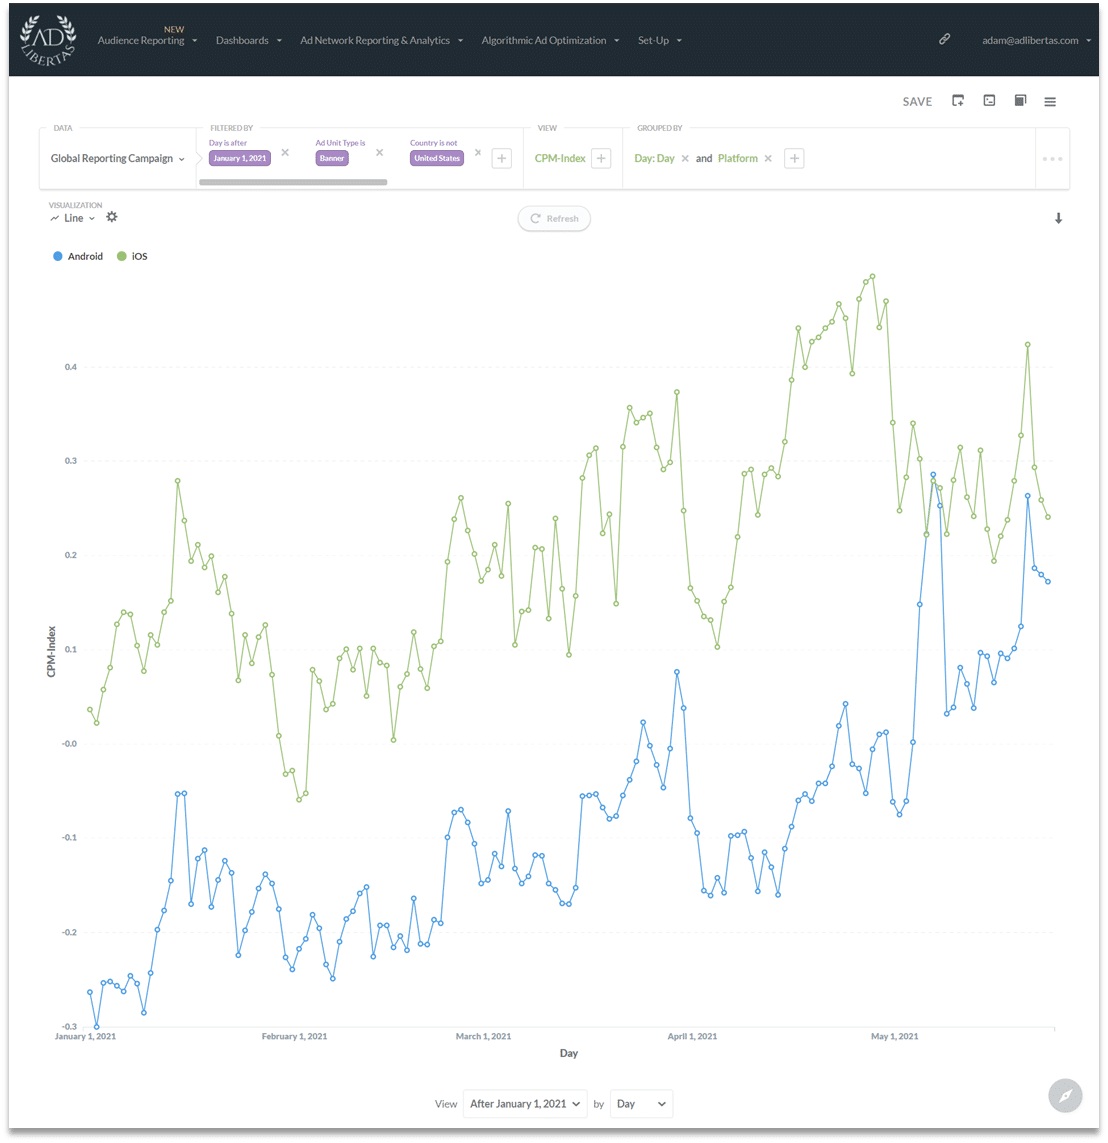
Banners:
While the good news is the iOS banner CPMs seem to be coming back – or at least stabilizing – the Android CPMs in the US are actually overcoming iOS in a very uncharacteristic and dramatic mid-year revenue spike. It certainly seems the Android CPMs are picking up what the iOS banners have lost.
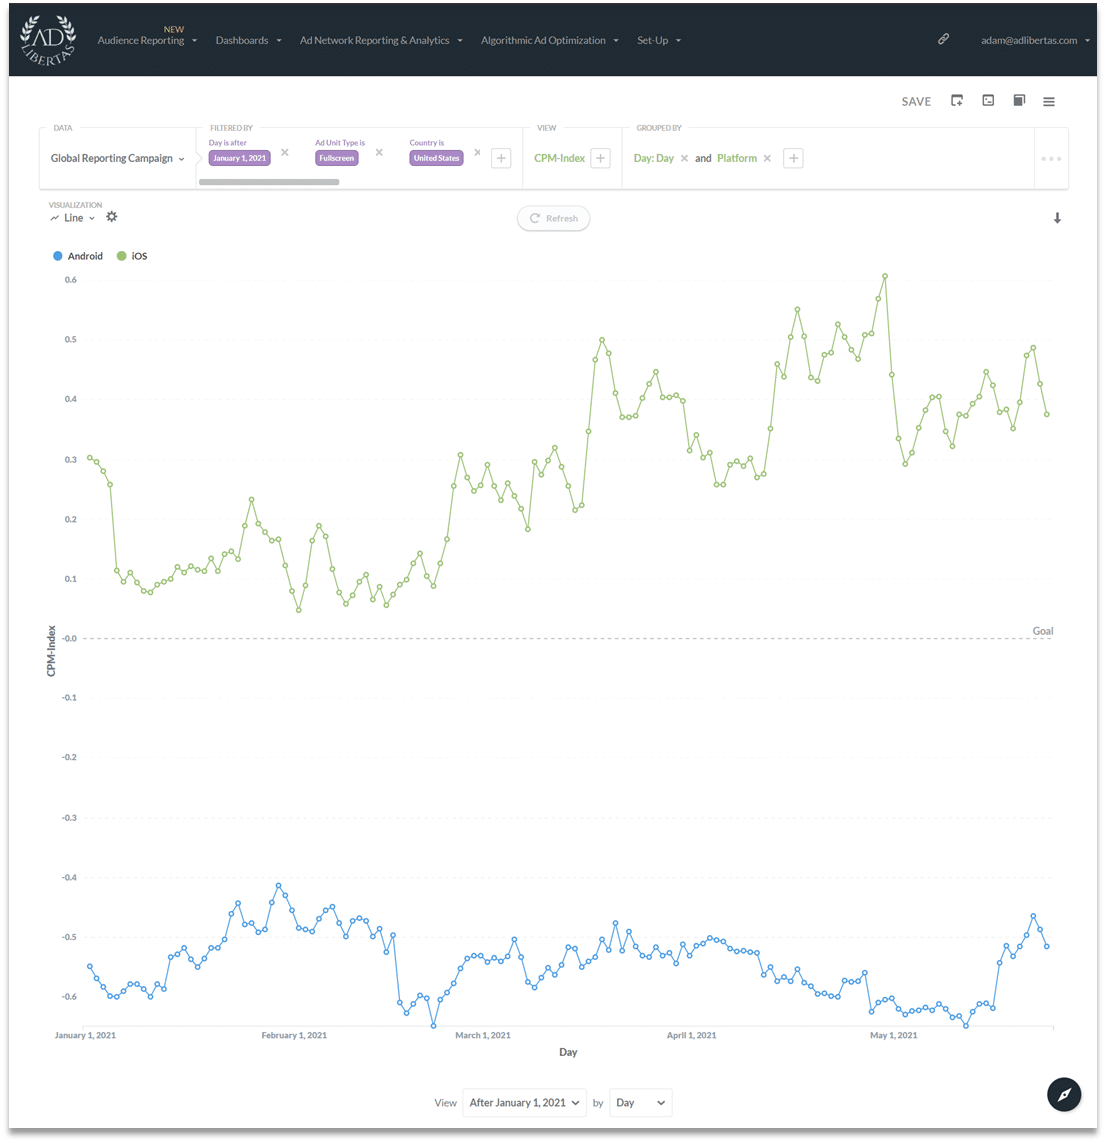
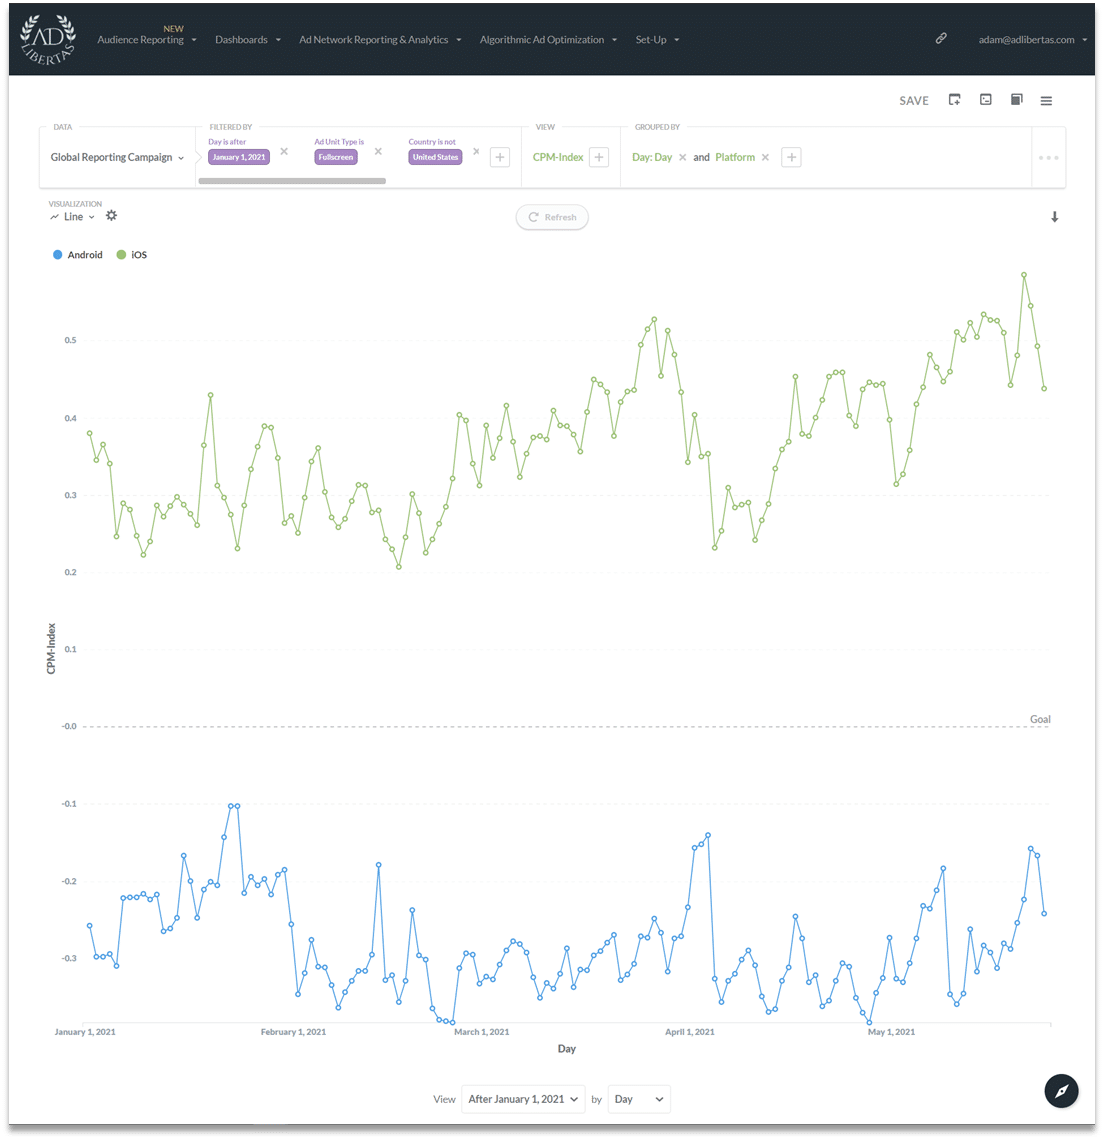
Fullscreens:
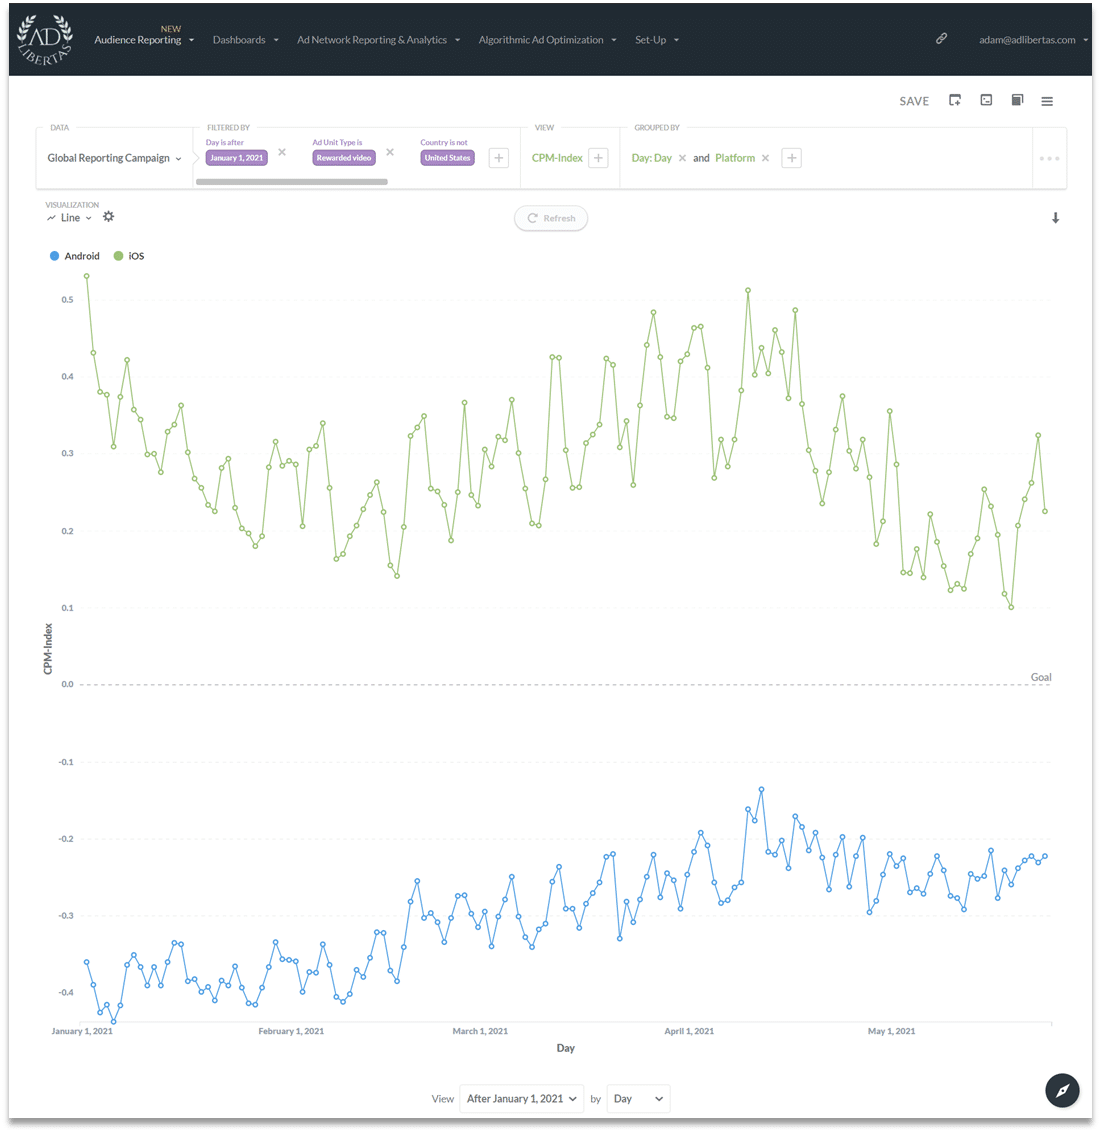
Full screens have stayed slightly down in the US – but are actually up outside of the US whereas Android has seen an uptick in both. However the index shows the large difference in average CPMs of Android v. iOS CPMs and the impact is muted as a result.
Reward Video:
iOS remains static in the US (and slightly down outside of the US) but, interestingly Android is seeing an uptick in the US that seems to indicate performance spend has shifted from iOS to Android.
Impact on User CPMs & LTVs
Anecdotally we’ve isolated the CPMs & LTVs of a single iOS & Android app to demonstrate how this may affect long-term user value.
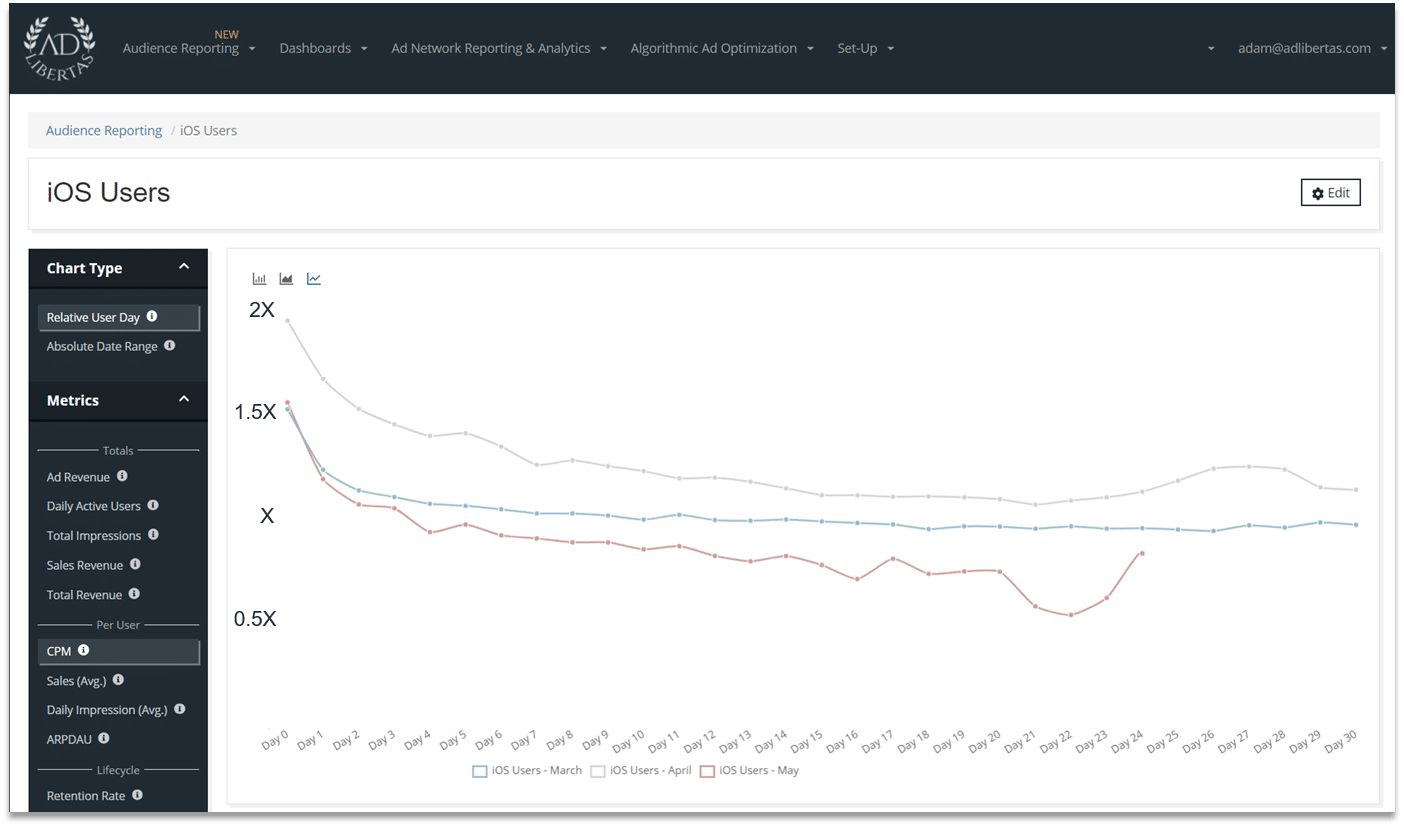
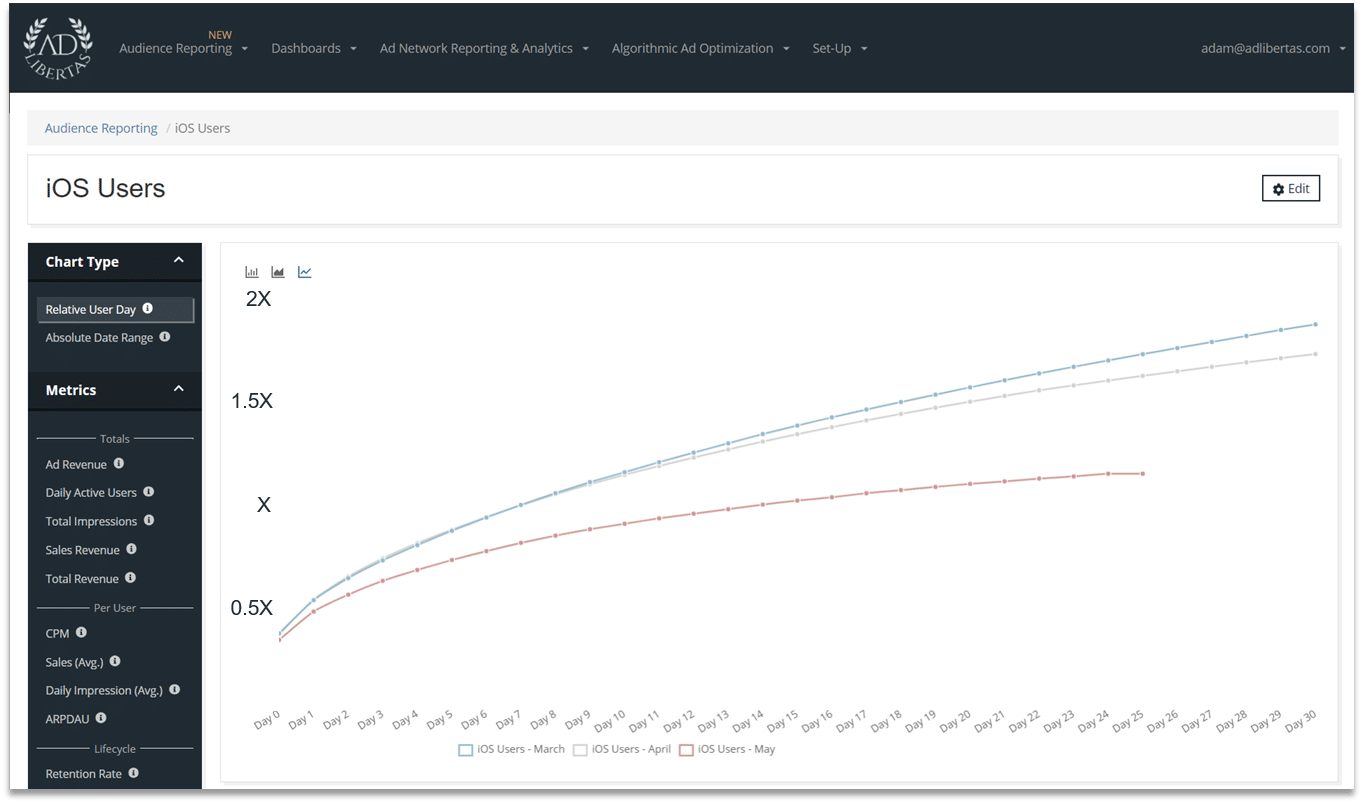
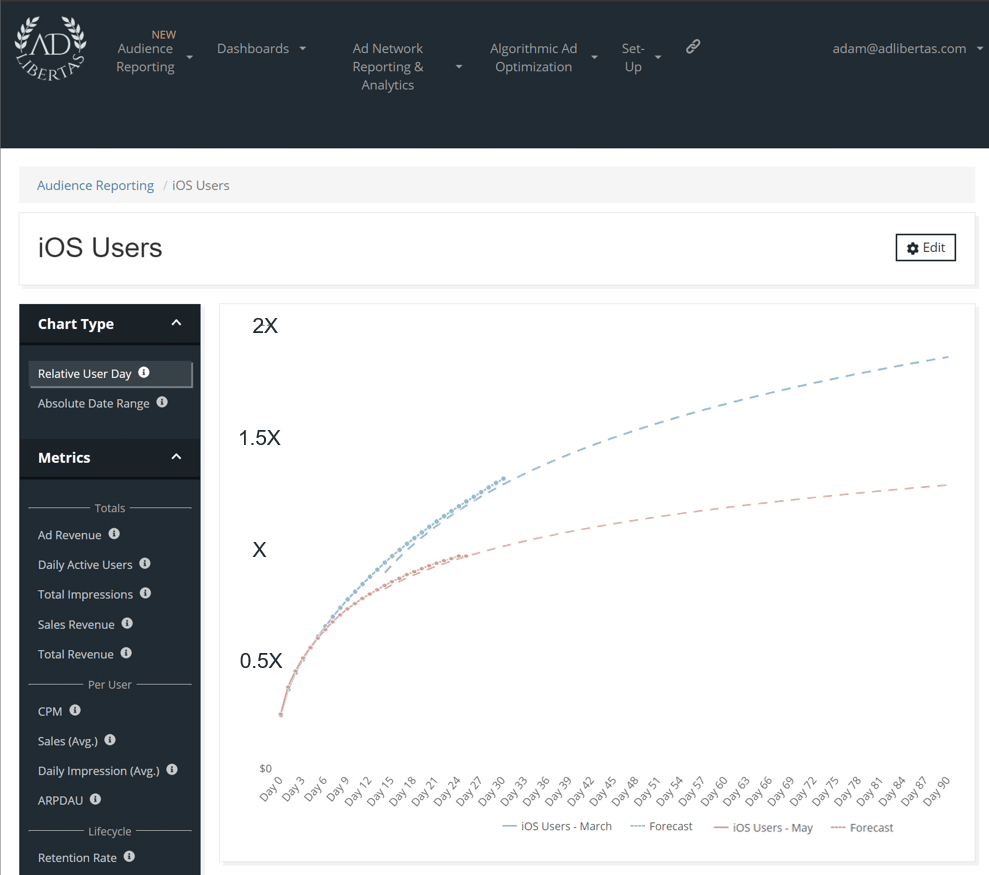
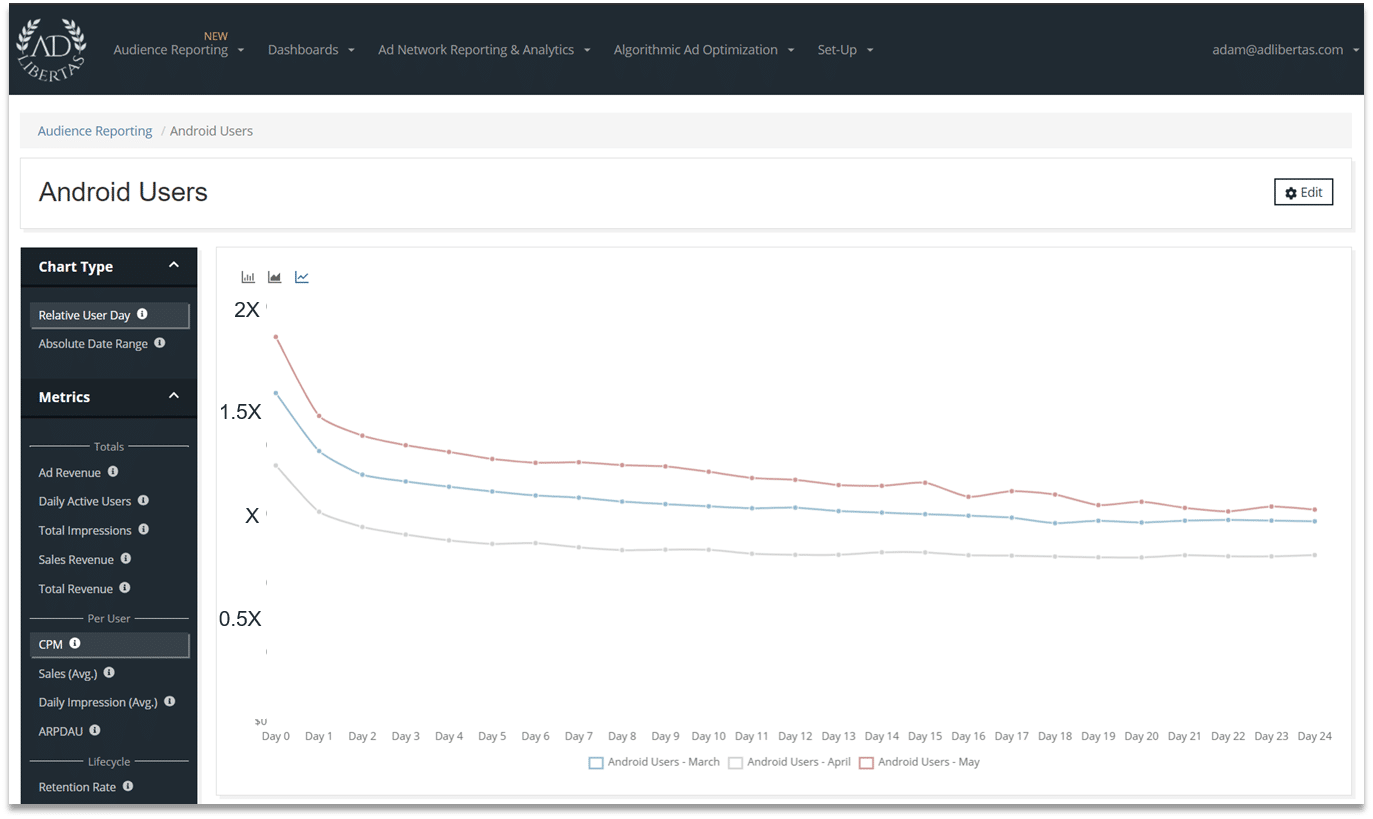
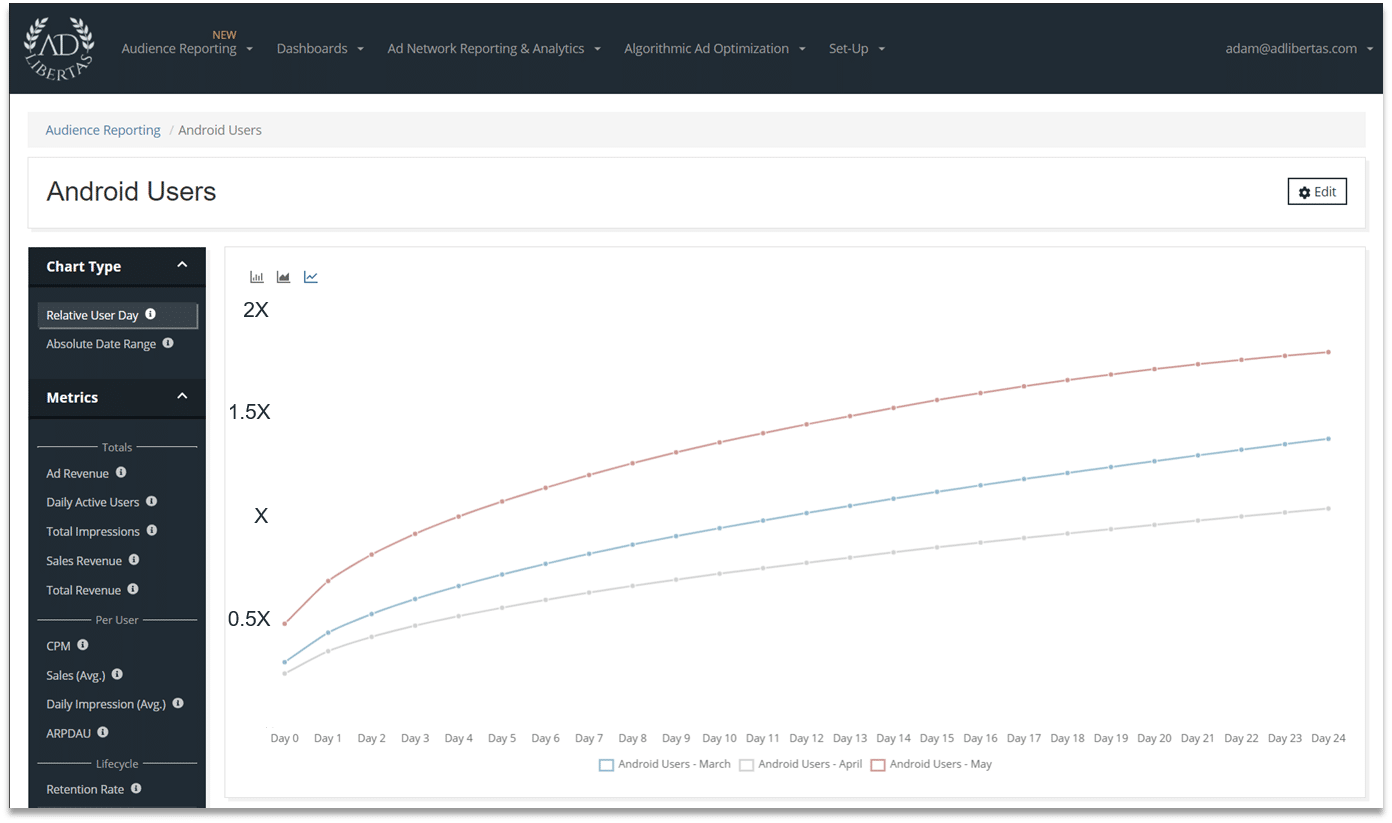
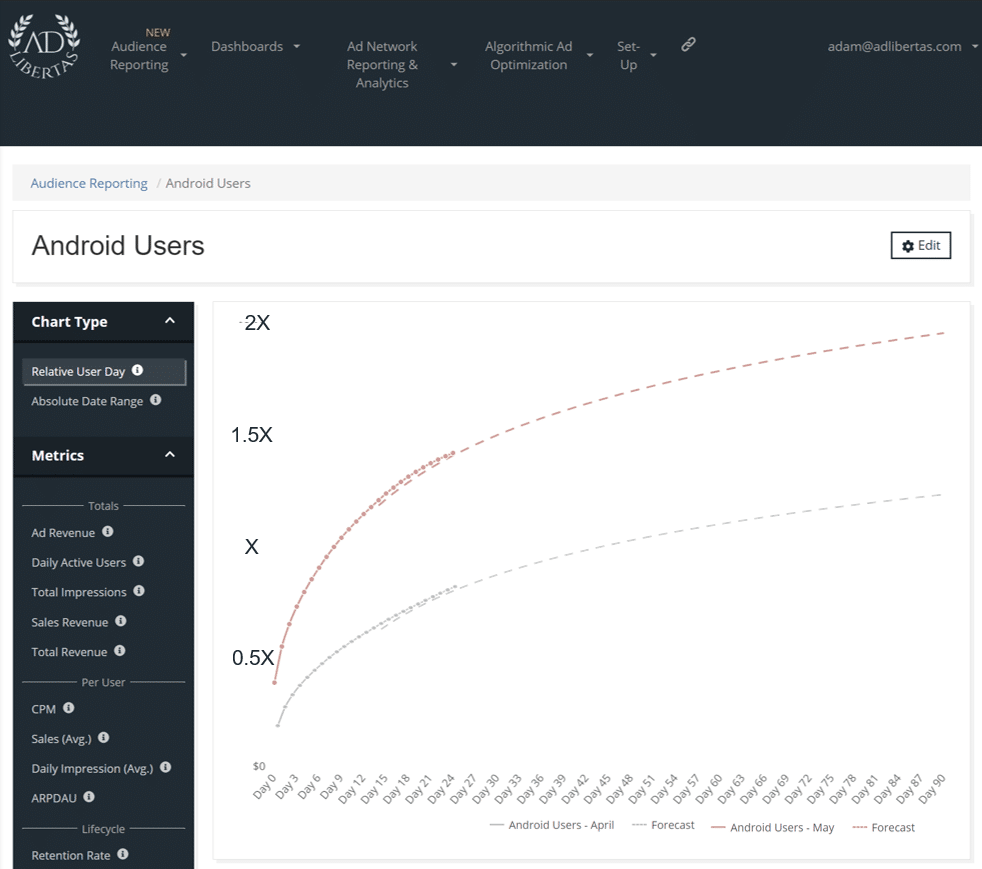
In all charts, the blue line shows users acquired in March; the grey April installers; and red line shows users acquired this month (May).
iOS User Value
On the left we see the CPM average of each cohort starting at their install-date (Day 0). April and May day-0 shows an average CPM at 1.5X the overall indexed average, where May users are 25% higher at 2X the average – likely due to the increased buying demand of April.
However the overall averages May CPMs fall at a rate higher than April, coming in about 50% lower than April averages.
90 pLTV of May installers are down ~50% compared to March.
90 iOS LTV prediction using a non-linear power regression. Equation takes the form Y=aX^b (documentation)
Android User Value
Day-0 monthly cohort CPMs on May installers is 15% higher than users who installed in April, growing to +22% difference by day 24. Overall averaged CPM of May users is 30% higher than April users.
90 day pLTV values of May Android users are up 60% over April installs.
90 Android LTV prediction using a non-linear logarithmic regression. Equation takes the form Y=a*ln(x)+b (documentation)
About Us:
AdLibertas makes tools to help app developers earn more from their apps. If you’re interested getting this measurement capability for your apps, see more details on you can connect your data sources into Audience Reporting on our product page. Or watch an introduction video below:
