14.5 CPM update: Android CPMs surpass iOS for the first time.
Ad rates for Android have caught up– and eclipsed– iOS for the first time ever on most ad formats. Is this the new normal?
The video is a walk-through of the data.
Previous installments:
The trend of anemic iOS CPMs continues due to increased iOS 14.5 adoption and lowered advertiser spending (see a report run by Singular that reviews ad spend shifting to Android). Android, for the first time in the history of the smartphone are showing regular CPM superiority when compared to iOS.
Read below for specific ad unit details.
Note: CPMs are listed as index values, therefore swings may be exaggerated (or minimized) based on normalized fluctuations.
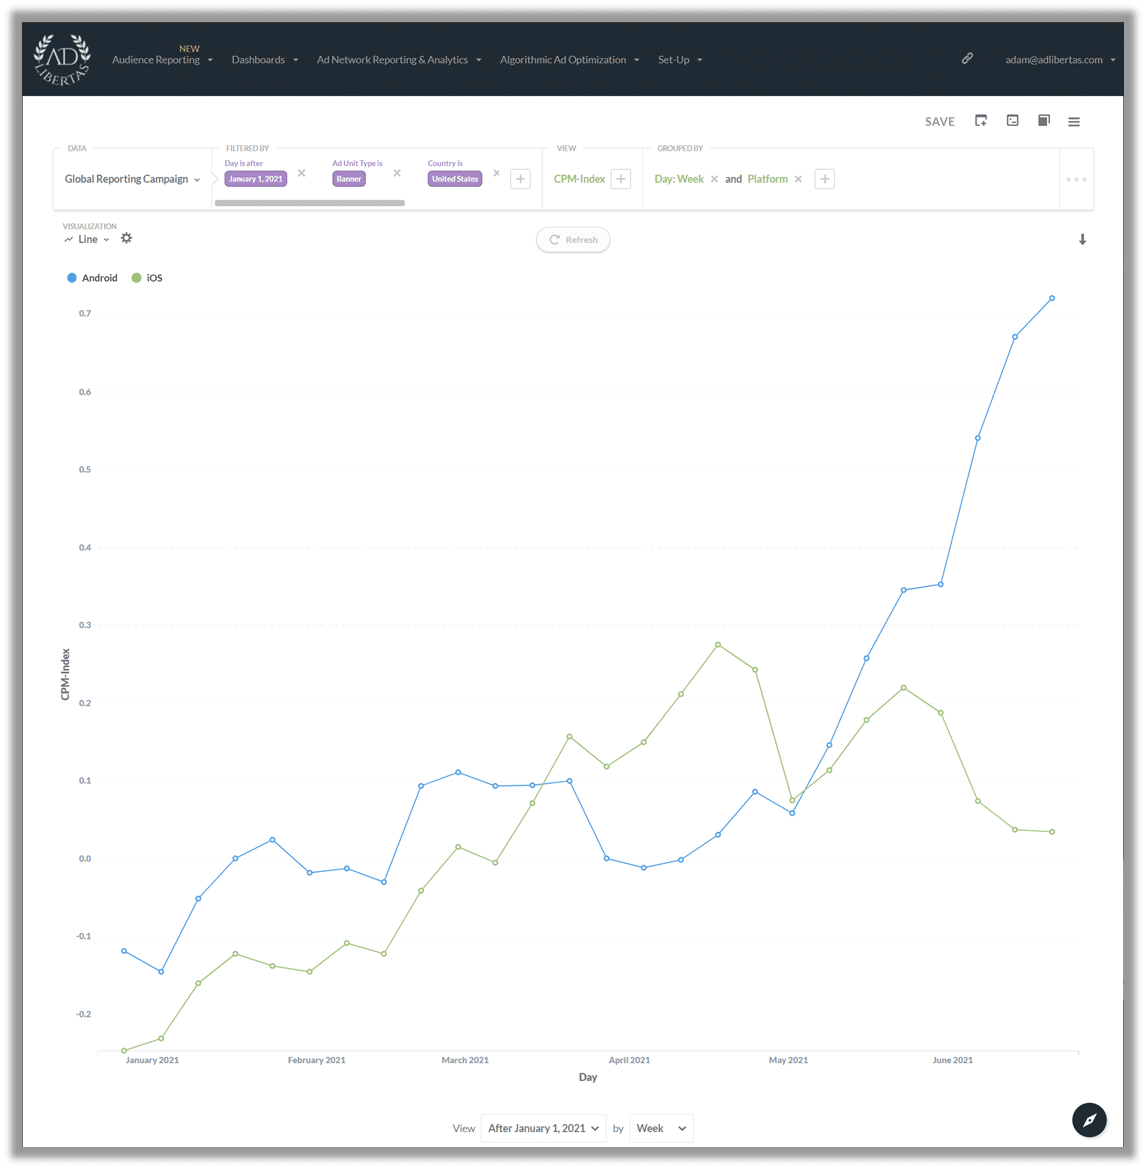
Banners:
CPMs on Android banners have spiked near the end of Q2 — some of this is due to Amazon’s yearly pre-Prime-Day spike, which this year largely only benefited Android — but overall a large variety of advertisers are paying higher rates for Android in the recent weeks.
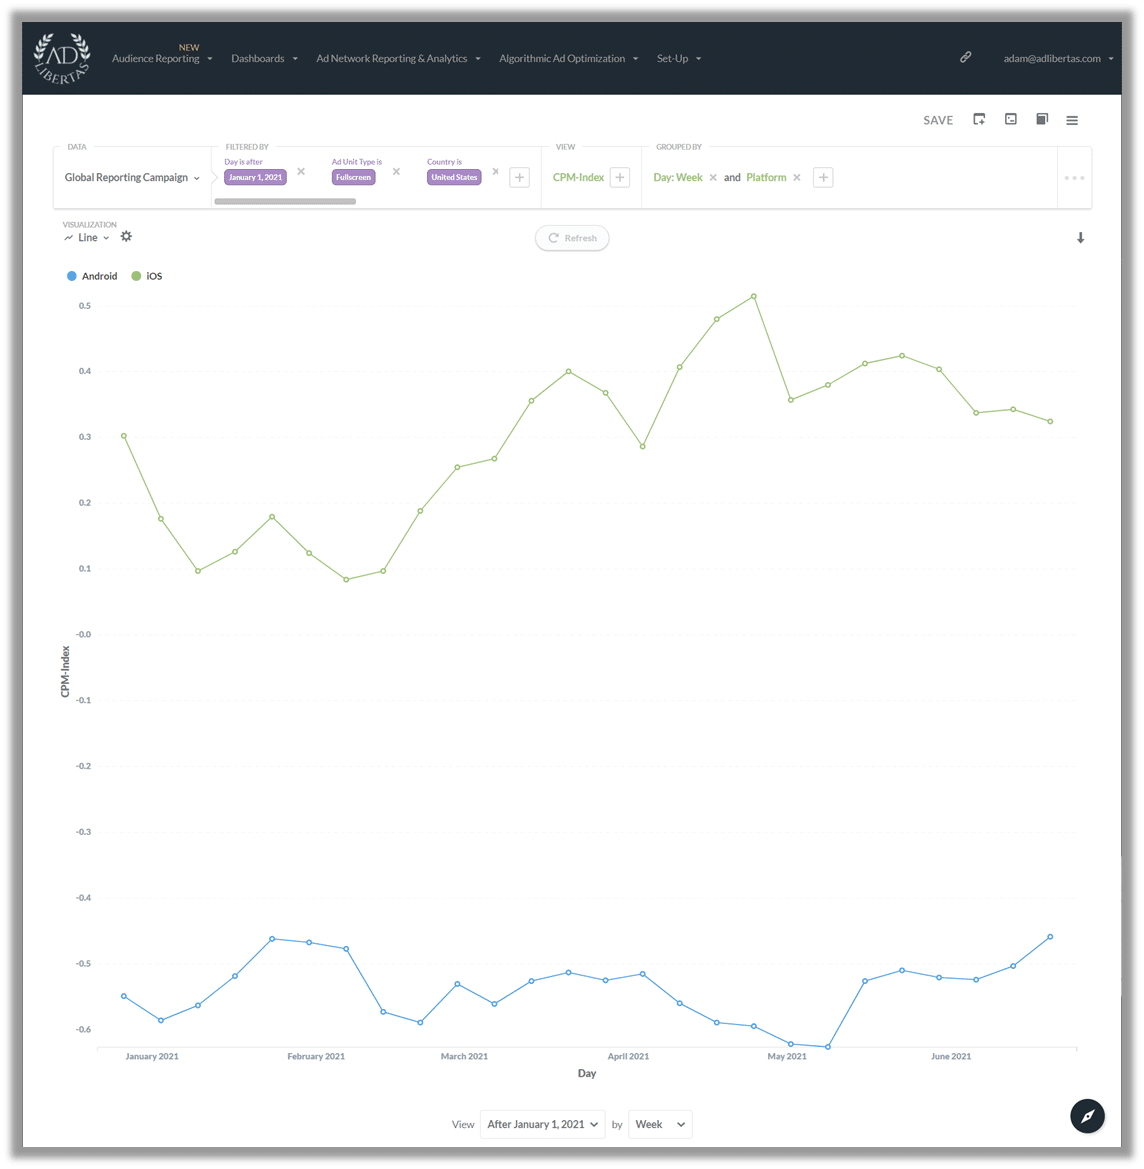
Fullscreens:
Interestingly– and strangely– we’ve seen relatively flat performance on full-screens when compared to the other units.
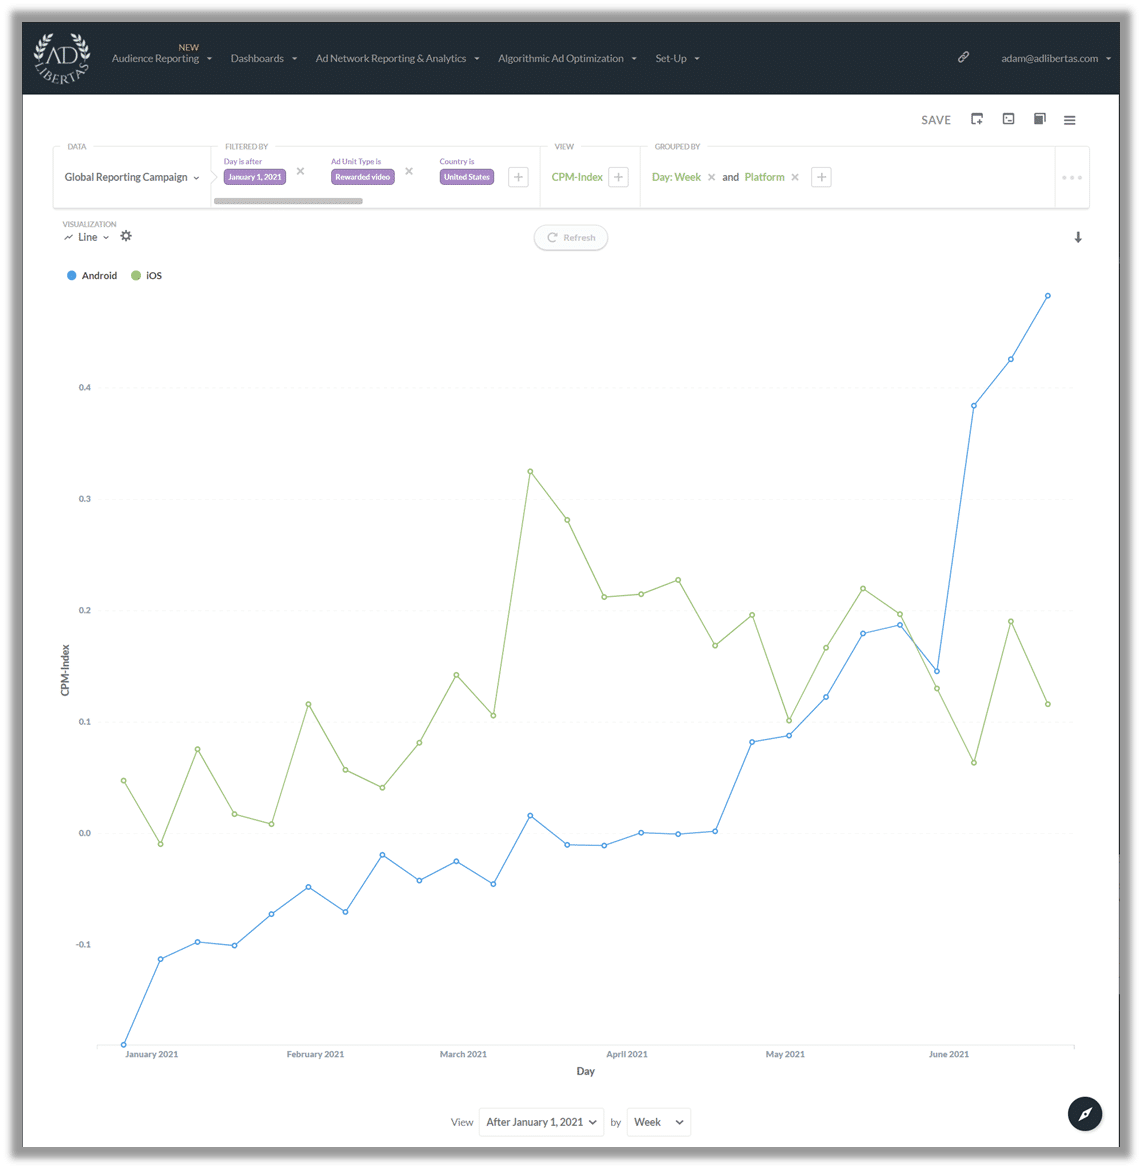
Reward Video:
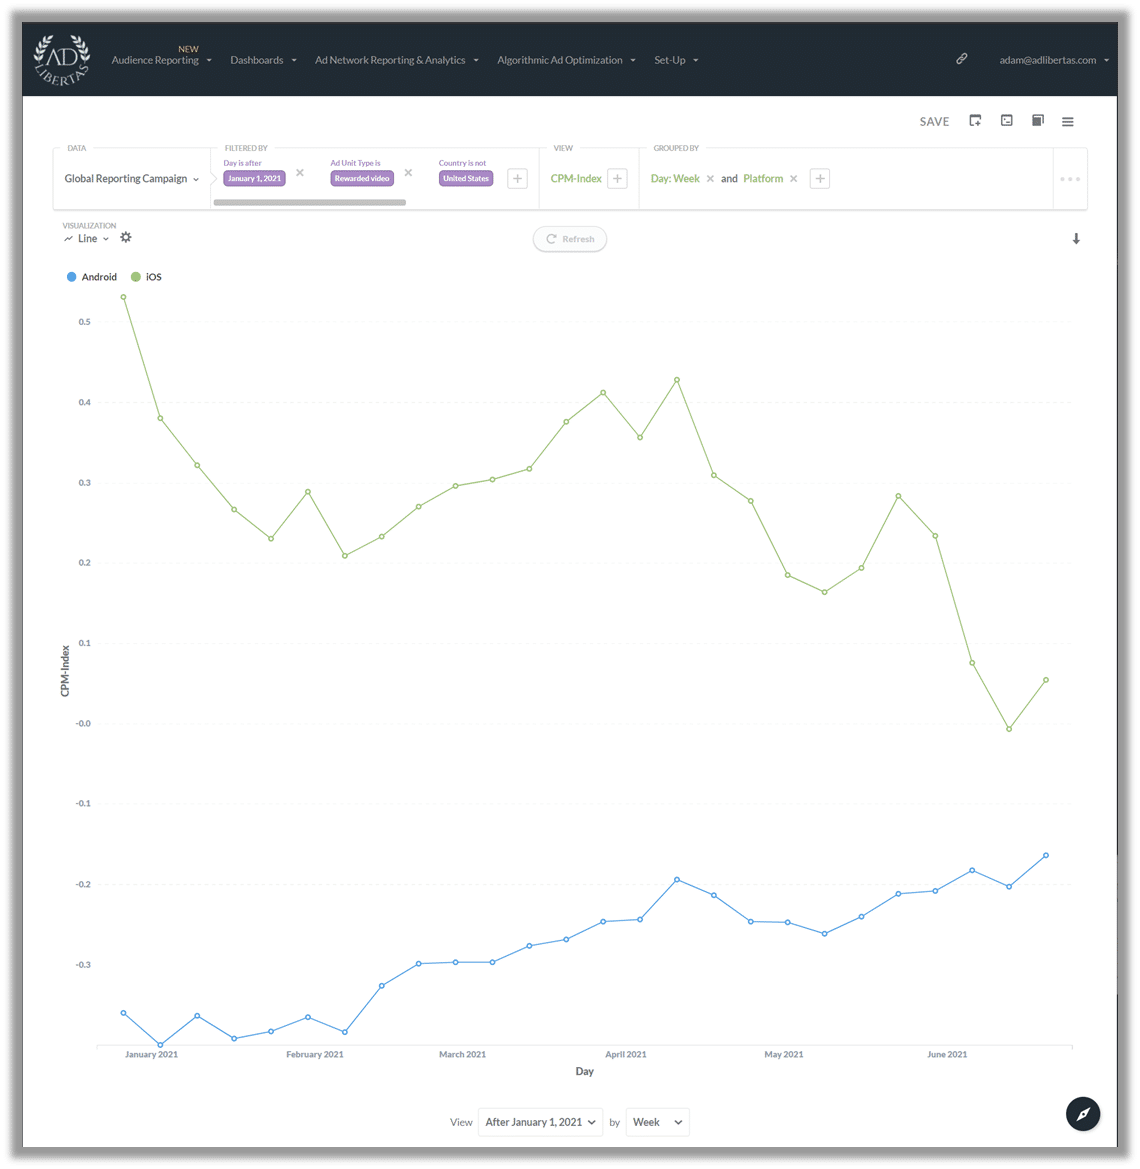
There was a big jump on Android CPMs for US traffic, surpassing iOS’ indexed CPM — largely driven by Facebook — where the US for iOS remains flat and falls slightly outside of the US where Android sees consistent gains.
Impact on User CPMs & LTVs
Anecdotally we’ve isolated the CPMs & LTVs of a single iOS & Android app to demonstrate how this may affect long-term user value.
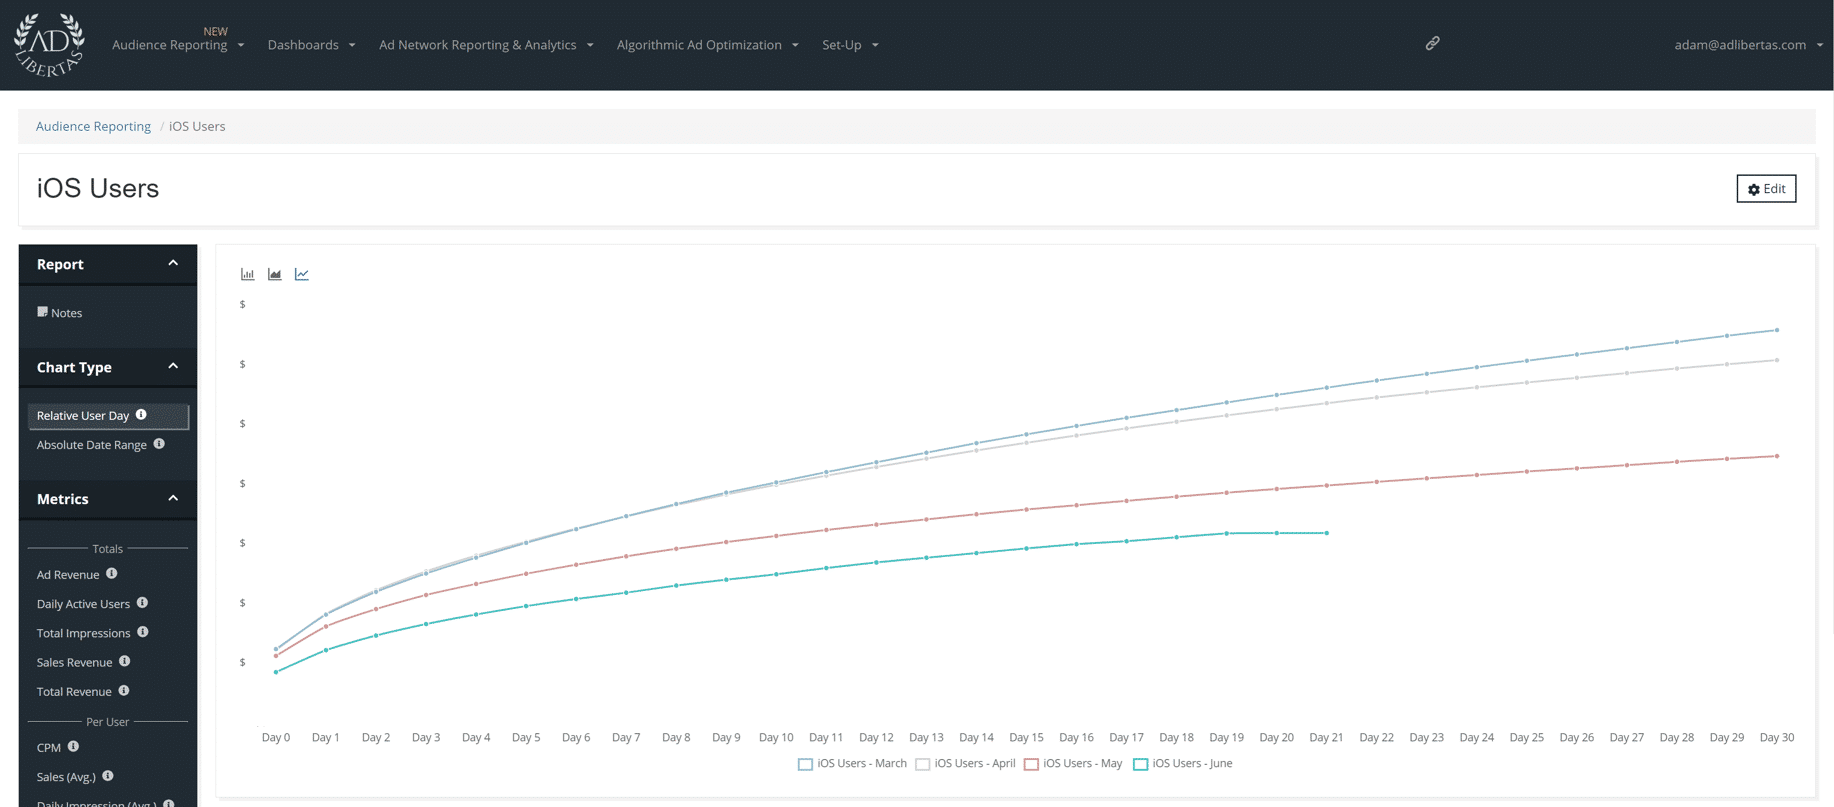
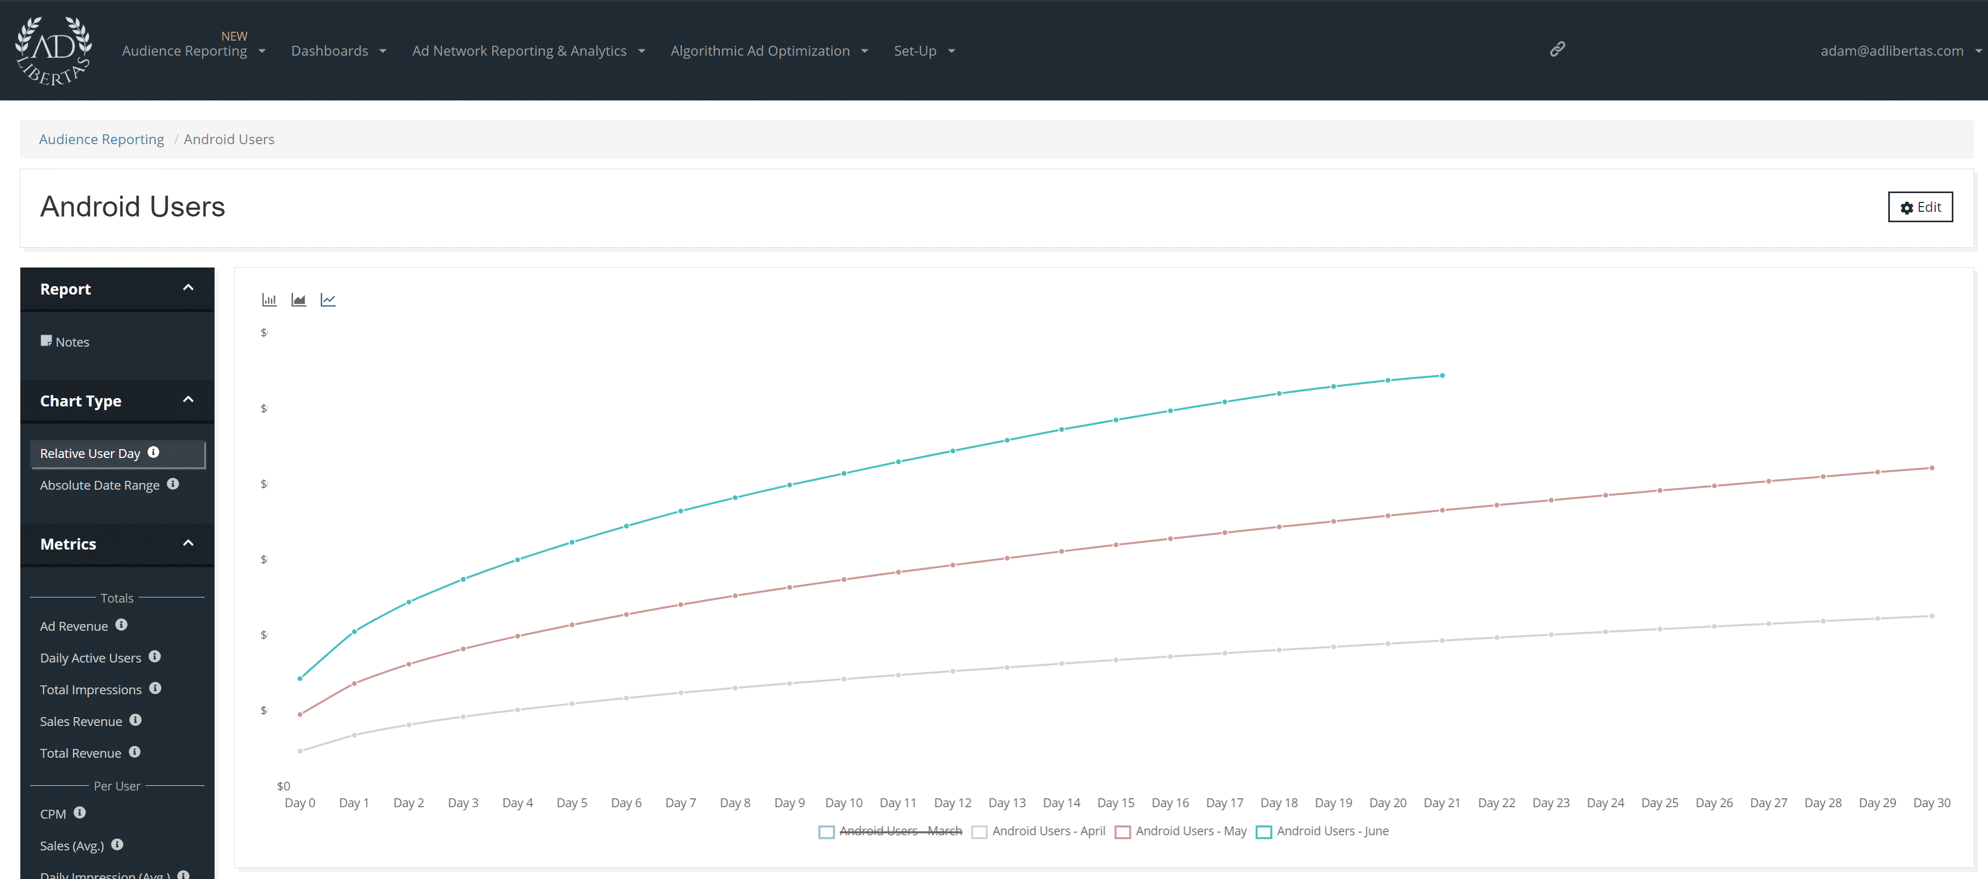
In all charts, the blue line shows users acquired in March; the grey April installers; the red line May and the green line is users acquired in June.
iOS User Value
iOS User LTV grouped by their install month.
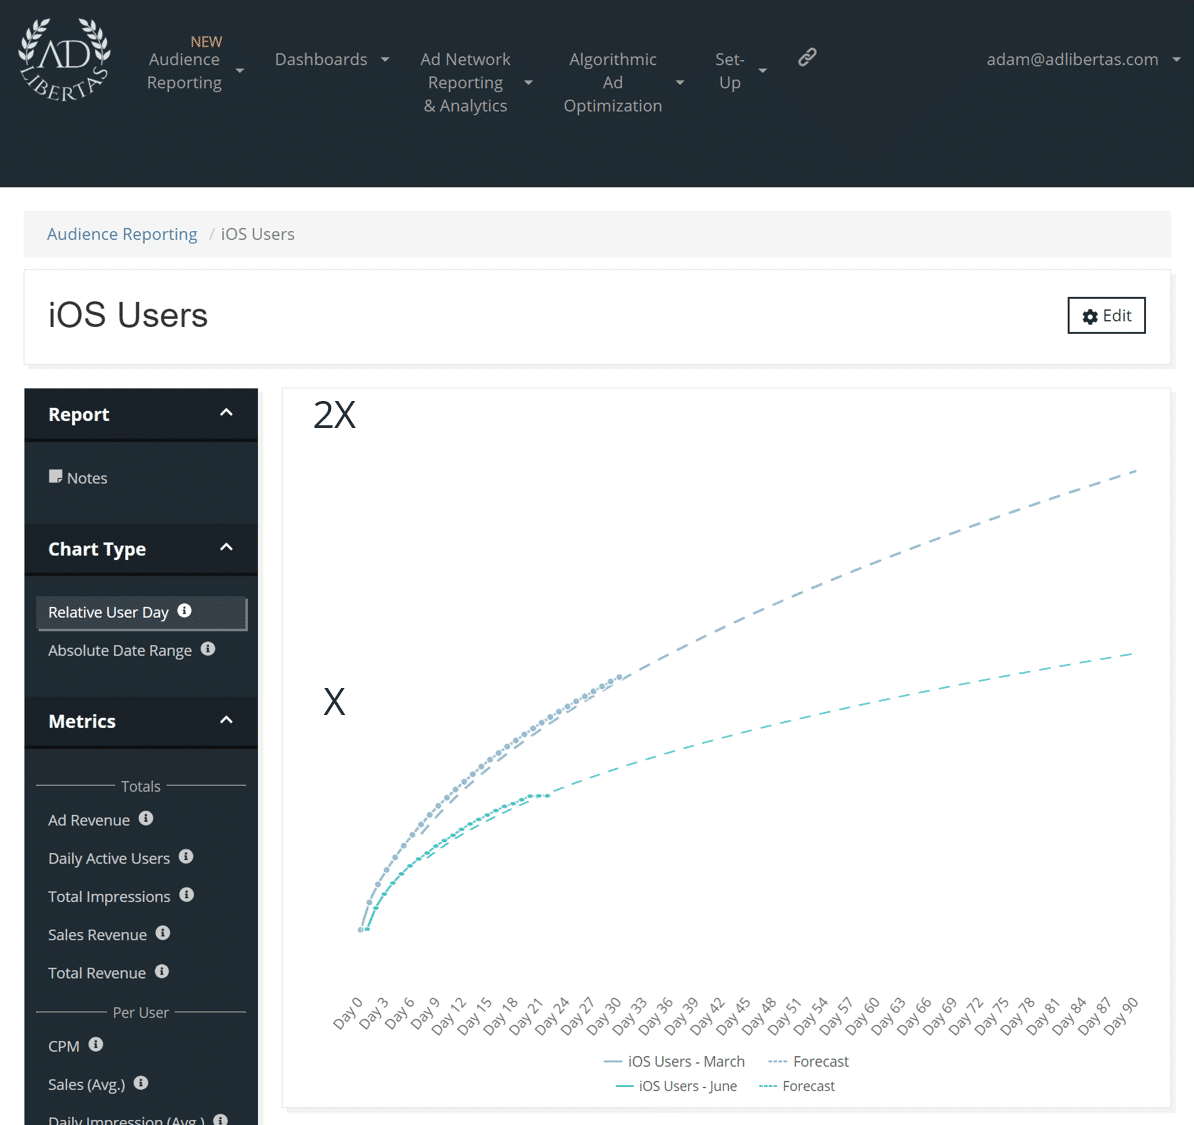
90 pLTV of iOS June installers are down ~50% compared to March.
90 iOS LTV prediction using a non-linear power regression. The equation takes the form Y=aX^b (documentation)
Android User Value
Android LTVs grouped by install-month
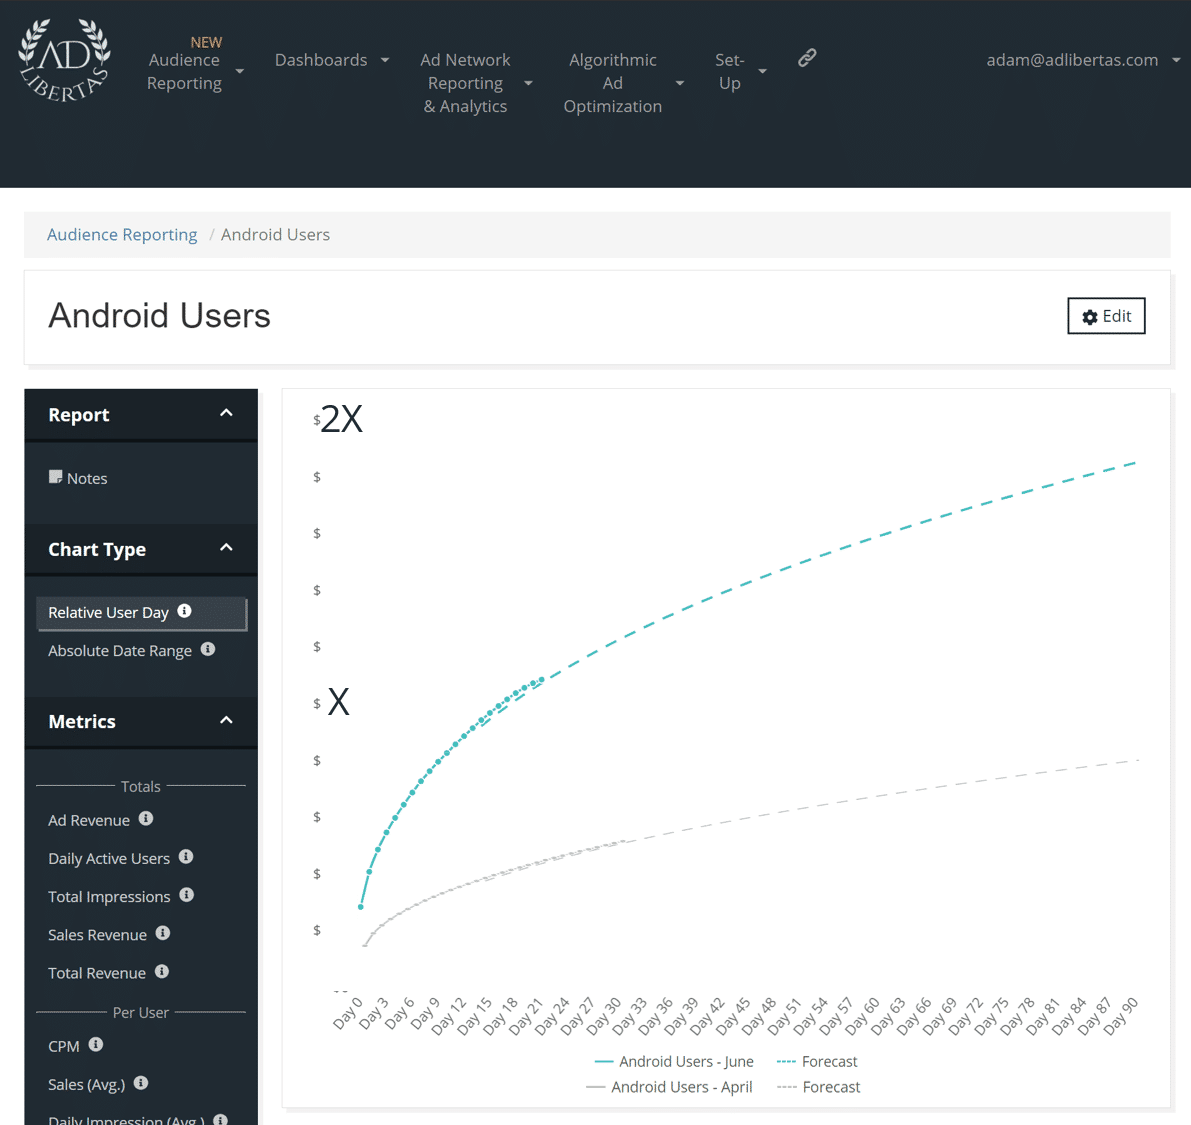
90-day pLTV values of June Android users are up 2.5X+ over April installs.
90 Android LTV prediction using a non-linear power regression curve. The equation takes the form Y=aX^b. (documentation)
About Us:
AdLibertas makes tools to help app developers earn more from their apps. If you’re interested in getting this measurement capability for your apps, see more details on you can connect your data sources into Audience Reporting on our product page. Or watch an introduction video below:
